– Impingement Cooling
– Impingement Jet Array Heat Transfer With Surface Textures
– Surface Roughness Characterization and Analysis
– Dimple Surface Arrays
– Swirl Chambers
– Surface Heat Transfer Augmentation Within Internal Passages
– Film Cooling
– Full-Coverage Film Cooling
– Double Wall Cooling
– Second Law Analysis of Film Cooling
– Aerodynamic Losses From Turbine Airfoils
– Transonic Turbine Blade Tips
– Transonic Turbine Blade Tips With Film Cooling
– Transonic Turbine Alloy Blades
– Supersonic Flow Experimental Results
– Shock Wave Unsteady Interactions
– Viscous Dissipation Within a Transonic Flow Environment
– Transitional Flows in Curved Channels
– Dean Flow Dynamics in Low-Aspect Ratio Spiral Microchannels
– Unsteady Laminar Impinging Slot Jets
– Electronics Cooling
– Miniature and Micro-Scale Pumps
– Slip Rarefaction Phenomena
– Elastic Instabilities
– Buoyancy-Driven Continuous SPLITT Fractionation
SURFACE ROUGHNESS CHARACTERIZATION AND ANALYSIS
Surface Roughness Characterization and Analysis
- Three-dimensional, non-uniform, irregular surface roughness.
- Determination of equivalent sandgrain roughness size entirely from roughness geometry.
- Internal channel surfaces and surfaces of turbine airfoils used in gas turbine engines.
- Reynolds analogy equations for real component surface roughness.
- Diverse range of industrial applications.
Increasing the heat transfer from internal surfaces is of great importance in a number of applications, including turbine fan blades, heat exchangers and small, high performance hydraulic systems. An increase in heat transfer of only 10% can have large performance and financial paybacks. Augmentation in the heat advected from a surface is usually accomplished by increasing the surface area and the number of turbulence trip points through some form of machining process. This becomes very difficult to achieve in internal passages, especially ones of small diameter or large aspect ratio (the ratio of length to width). One method to overcome this is to add material instead of removing it. This can be realized by applying a spray or coating of molten metal such as nickel on a steel base. This process provides a sandpaper-like surface, which generally increases surface heat transfer rates as the equivalent sandgrain roughness size increases.
Determination of Equivalent Sandgrain Roughness Size Entirely from Roughness Geometry
A new numerical procedure was developed at the University of Utah to calculate the equivalent sand grain roughness ks of any three-dimensional rough surface with irregular geometry and arrangement.
An analytic check of the numerical procedure and accuracy is provided by comparisons of numerically determined k s values with analytic geometry results for several types of uniformly shaped and spaced roughness elements, originally investigated by Schlichting, and later analyzed further by Coleman et al. The resulting equivalent sand grain roughness values differ by less than a few percent. Additional checks on the numerical procedures are provided by measurements made using two different surfaces with non-uniform, three-dimensional roughness with irregular geometry and arrangement. The facility used to obtain these measurements is shown in Figure 1. A total of three sets of test plates are tested in a two-dimensional channel, which are denoted smooth, completely rough, and patterned rough. The smooth wall surface provides baseline results. Measured in the two-dimensional channel flows are streamwise pressure gradient, and skin friction coefficients at Reynolds numbers based on hydraulic diameter of 10,000, 15,000, 20,000, and 25,000.
Figure 2 shows that measured skin friction coefficients for these surfaces agree very well with existing correlations, which are based on roughness Reynolds numbers determined using equivalent sandgrain roughness ks values calculated using the new numerical procedures. For both rough surfaces tested, the differences between these numerical equivalent sand grain roughness sizes, and values determined from the measurements is less than 1 percent for all Reynolds numbers based on hydraulic diameter considered. A comparison of these equivalent sand grain roughness values is shown in Figure 3.
The techniques developed to determine of equivalent sandgrain roughness size entirely from roughness geometry are valuable because they enable the determination of equivalent sand grain roughness magnitudes, for such irregular roughness, entirely from roughness geometry after it is characterized using three-dimensional optical profilometry data. An example of such optical profilometry data is shown in Figure 4. Determination of such roughness characteristics from roughness geometry is important because it leads to reduced design uncertainties, lower production and part costs, and increased component life in machinery which operate with moving fluids. The results are also beneficial for the analysis of different three-dimensional rough surface geometries, as well as for the development of numerical prediction models to account for the effects of roughness.
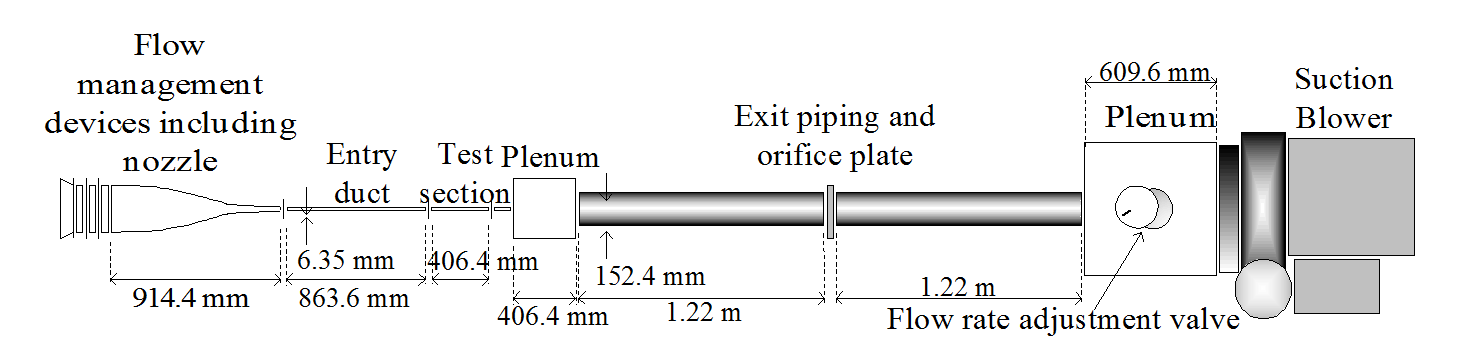
Figure 1. Schematic diagram of the flow test facility with components and dimensions
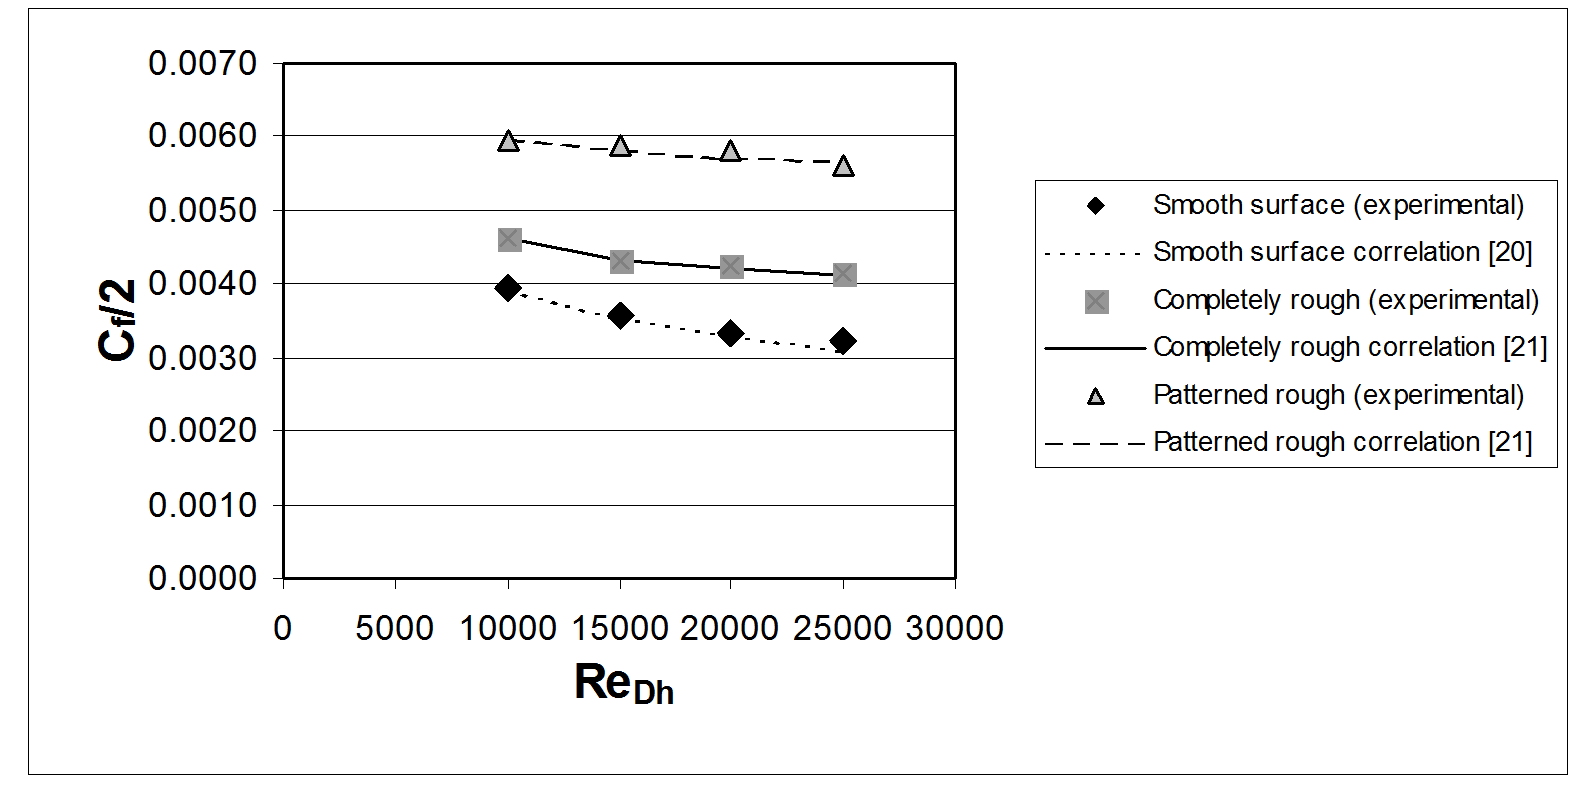
Figure 2. Comparisons of experimentally and numerically determined skin friction coefficients
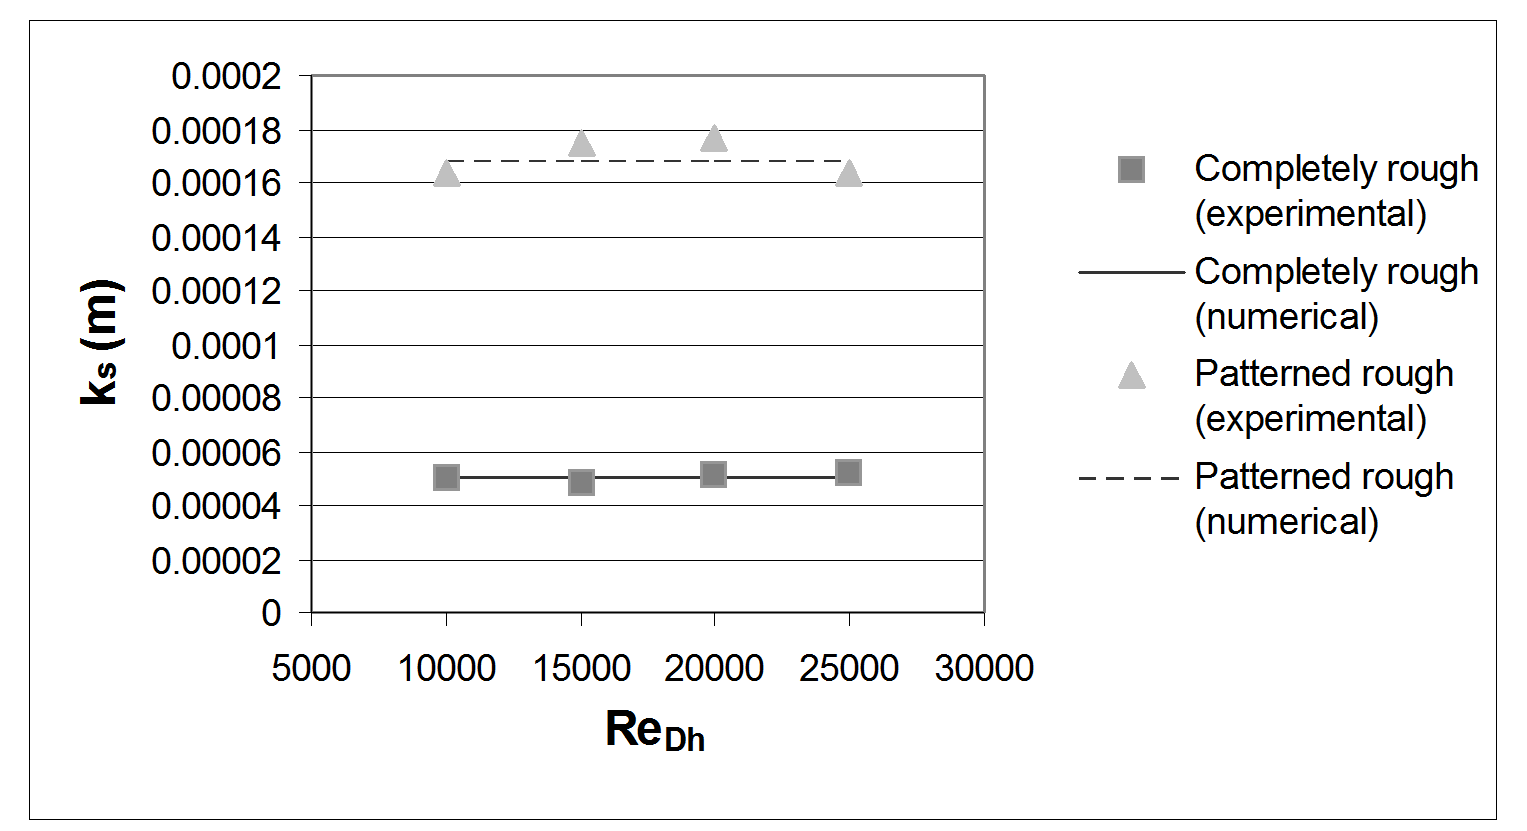
Figure 3. Comparisons of experimentally and numerically determined equivlanet sandgrain roughness k s values
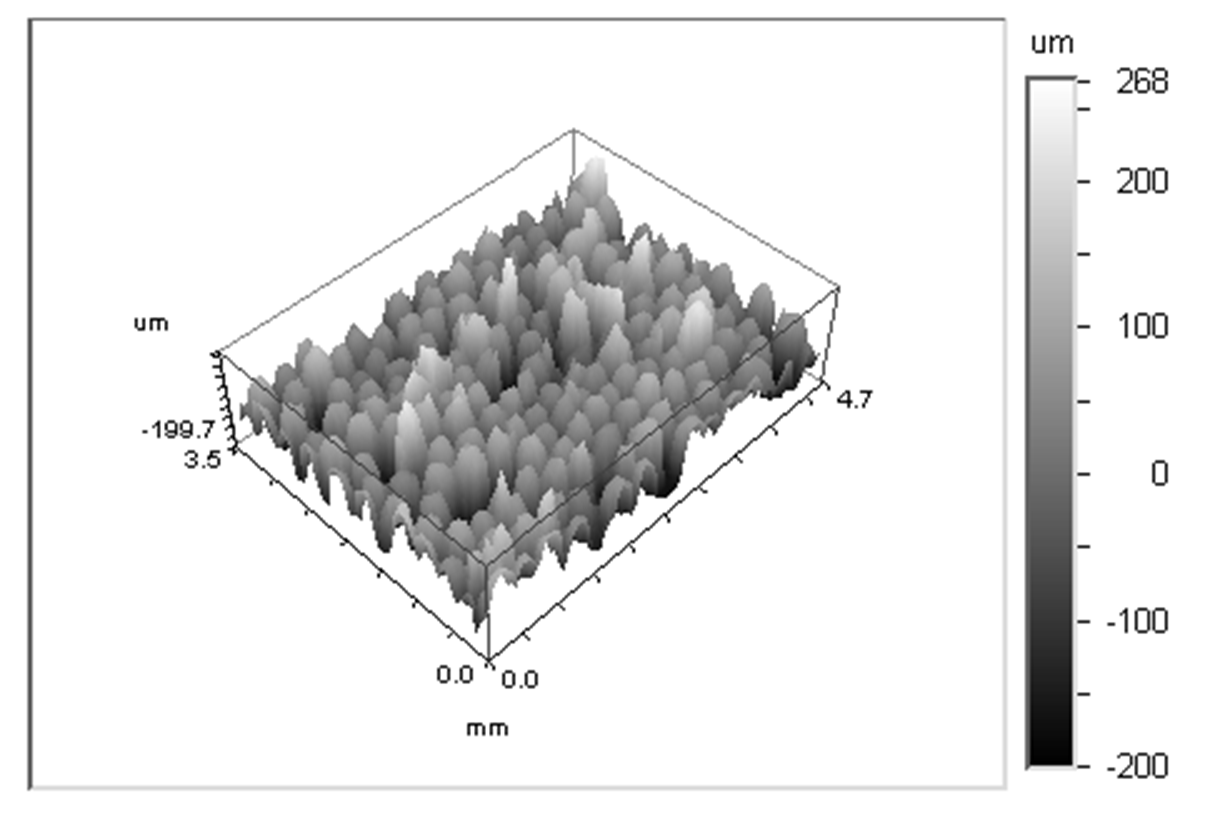
Figure 4. Three-dimensional Wyko profilometry trace of a portion of the completely rough test surface
Reynolds Analogy for Irregular, Three-Dimensional Roughness
Recent research at the University of Utah led to a new Reynolds analogy equation for roughness which is similar to that which exists on the external surfaces of some turbine airfoils under extreme operating conditions, or on surfaces of other operating industrial devises, with deposit accumulation, such as heat exchangers. The equation, and the experimental results which are employed to deduce this equation, are then representative of the roughness which exists naturally as a result of common manufacturing, operation, and aging processes, rather than for the artificial roughness like that employed in many other experimental studies. Measured results include local skin friction coefficients, local Nusselt numbers, and local Stanton numbers for a pair of polished smooth surfaces, and for two other pairs of surfaces with different levels of irregular, three-dimensional surface roughness. Performance parameters, and magnitudes of St/(Cf /2) are also given, after they are determined from measured quantities. All of these results are obtained for transitionally rough flows at Reynolds numbers (based on hydraulic diameter) from 10,000 to 25,000 in an internal channel with an aspect ratio of 8, arranged with the instrumented test plates installed on the two widest surfaces. Each of the measured parameters is thus based on the area of the top and bottom surfaces of the channel only.
Surfaces with real component surface roughness, with irregular, three-dimensional shapes and irregular distributions along the test surfaces, give a Reynolds analogy equation which is different from ones associated with uniformly shaped roughness elements placed in a regular array with uniform spacing and arrangement. The new Reynolds analogy, for three-dimensional, irregular roughness, is given by
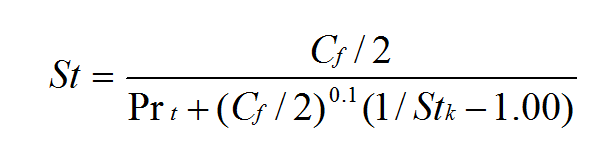
In this equation, Stk is the roughness conduction sublayer Stanton number, Prt is the turbulent Prandtl number, St is the Stanton number, and Cf/2 is the skin friction coefficient.
As shown below, this equation provides a good representation of St/(Cf/2) values for three-dimensional, irregular roughness. This new equation is also needed because Stanton numbers and Nusselt numbers, measured on surfaces with real component roughness, show important differences from existing correlations for artificial man-made roughness, or uniformly-shaped roughness elements arranged in a regular pattern. Note that the above equation is verified using air at atmospheric conditions. Additional experiments are needed to verify the accuracy of the equation for molecular Prandtl numbers which are significantly different from 1.0.
With equivalent sandgrain roughness values determined, experimental skin friction coefficients for the two rough test surfaces are compared with values from the Colebrook correlation for transitionally rough flow (roughness Reynolds numbers between 5 and 70). This equation is given by
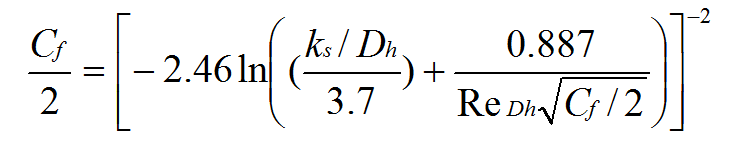
Figure 5 shows that skin friction coefficient values, determined using ks values from roughness geometry and this equation, are in excellent agreement with measured skin friction coefficients (after the influences of the smooth side walls are removed).
Because heating is only applied to the top and bottom surfaces of the channel, the experimental Nusselt numbers and Stanton numbers are largely unaffected by the side walls of the channel, and are representative of the top and bottom test surfaces only. The Nusselt numbers presented here are determined from averages of the local values measured at the two thermocouple locations which are on opposite sides of the channel at each x location, 123.5 mm and 246.9 mm. Note that the two local Nusselt number values at each of these x locations are in close agreement for all experimental conditions investigated.
Figure 6 presents Nusselt numbers for all three types of test surfaces. Here, Nusselt numbers increase continuously with Reynolds number based on hydraulic diameter for each test surface, with higher rates of increase for the rough1 and rough2 surfaces, compared to the smooth surfaces. At each Reynolds number based on hydraulic diameter, the smooth test plates give the lowest Nu values, and the rough2 test plates produce the highest Nu values. For each surface tested, the Nusselt numbers at x =123.5 mm slightly higher than values at x =246.9 mm.
Magnitudes of St/(Cf/2) for all three sets of test surfaces ( smooth , rough1 , rough2 ) are determined. Note that the St and Cf/2 values employed to deduce this ratio are each representative of the top and bottom surfaces of the channel only. Both quantities are thus based on the same test surface area. Here, average Stanton number values for x=246.9 mm are presented because they are more representative of thermally fully-developed flow than values measured at the upstream thermocouple locations.
Figure 7 shows that the present data from both rough test surfaces, as dependent upon Reynolds number based on hydraulic diameter, are more accurately represented by the new Reynolds analogy equation given above. The new Reynolds analogy equation is thus a more accurate Reynolds analogy for surfaces with irregular, three-dimensional real component roughness, than given by other existing correlation equations. This is further illustrated by Figure 8, which shows the equation compared to the present rough surface data, when plotted as dependent upon roughness Reynolds number.
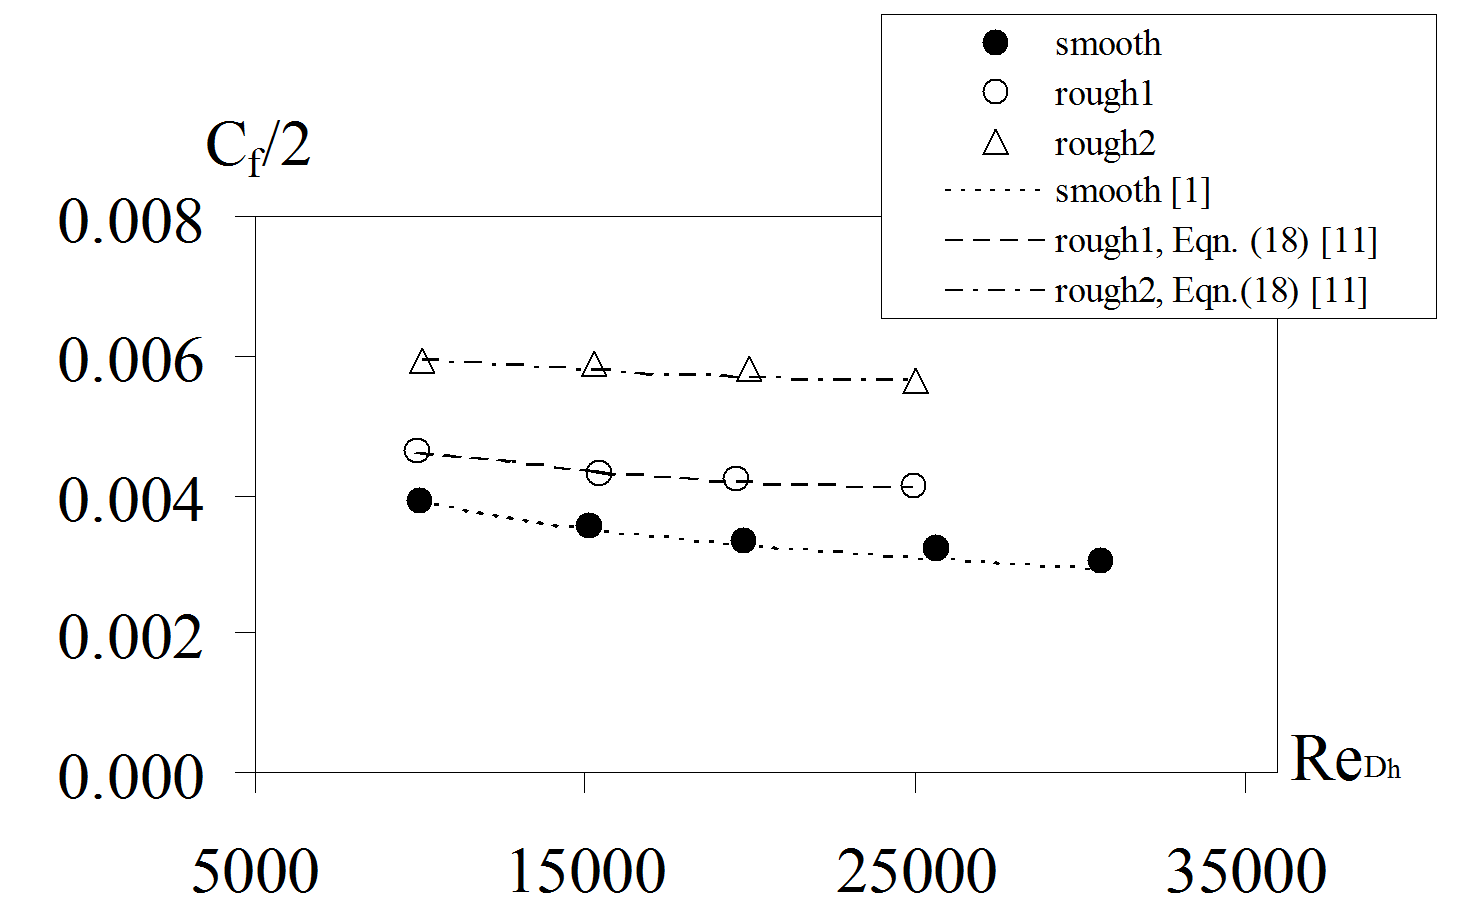
Figure 5. Measured skin friction coefficients for the smooth , rough1 , and rough2 test surfaces along with values obtained from correlations
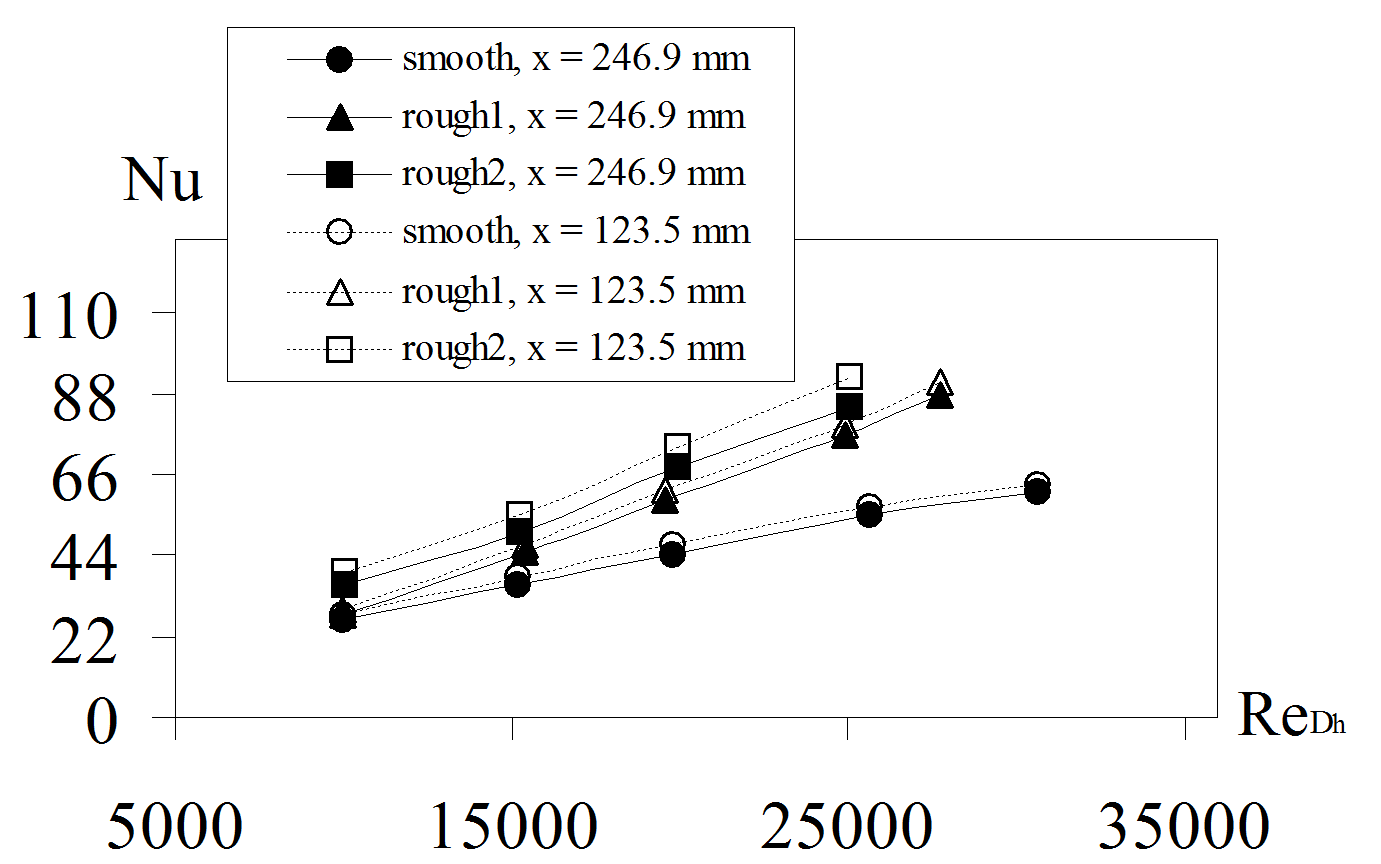 Figure 6. Measured Nusselt numbers for the smooth , rough1 , and rough2 test surfaces
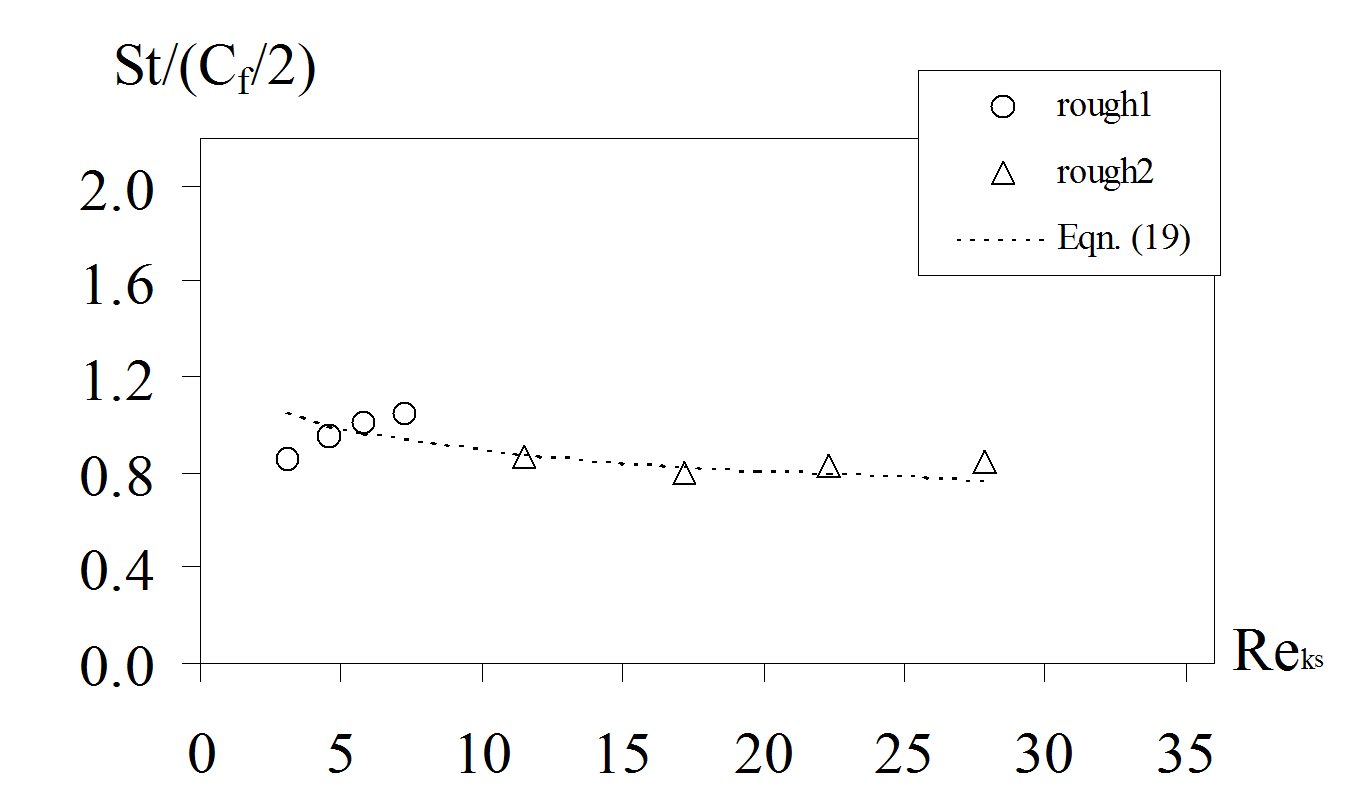
Figure 7. Measured magnitudes of St/(C f /2) for the rough1 and rough2 test surfaces as dependent upon Reynolds number based on hydraulic diameter, along with the Reynolds analogy equation for real component surface roughness. Smooth surface experimental values are included for comparison
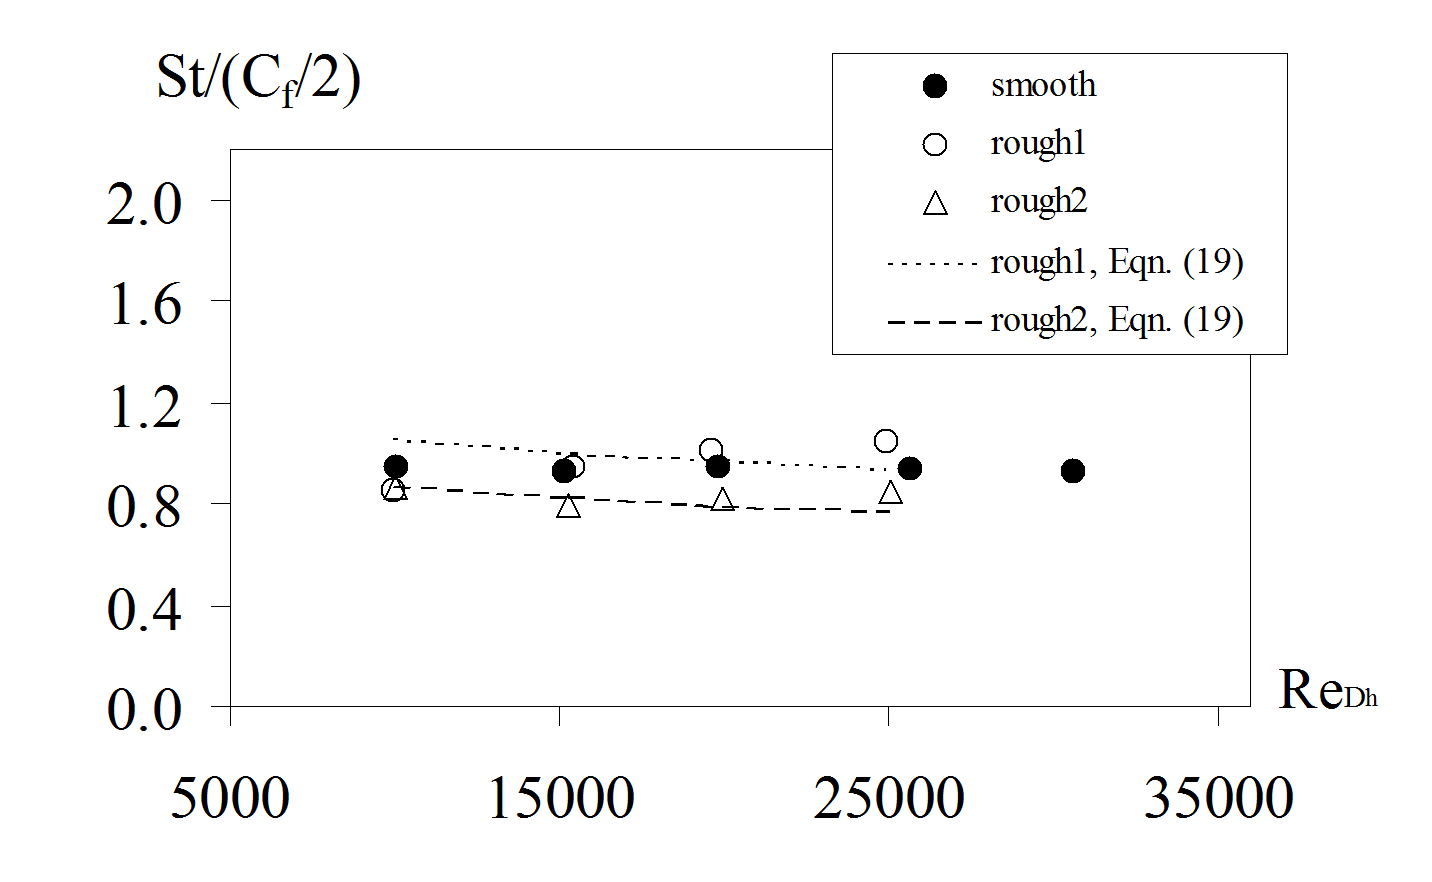
Figure 8. Measured magnitudes of St/(C f /2) for the rough1 and rough2 test surfaces as dependent upon roughness Reynolds number, along with the Reynolds analogy equation for real component surface roughness
REFERENCES:
Artificially Thickening a Smooth-Wall Turbulent Boundary Layer (P. M. Ligrani and R. J. Moffat), American Institute of Aeronautics and Astronautics Journal, Vol. 17, No. 8, pp. 907-910, August 1979.
A Heat Transfer Prediction Method for Turbulent Boundary Layers Developing Over Rough Surfaces with Transpiration (P. M. Ligrani, W. M. Kays and R. J. Moffat), International Journal of Heat and Mass Transfer , Vol. 24, No. 4, pp. 774-778, April 1981.
Artificially Thickened Turbulent Boundary Layers for Studying Heat Transfer and Skin Friction on Rough Surfaces (P. M. Ligrani, R. J. Moffat and W. M. Kays), ASME Transactions-Journal of Fluids Engineering , Vol. 105, No. 2, pp. 146-153, June 1983.
Thermal Boundary Layers on a Rough surface Downstream of Steps in Wall Temperature (P. M. Ligrani and R. J. Moffat), Boundary Layer Meteorology , Vol. 31, No. 2, pp. 127-147, February 1985.
The Structure of Transitionally Rough and Fully Rough Turbulent Boundary Layers (P. M. Ligrani and R. J. Moffat), Journal of Fluid Mechanics , Vol. 162, pp. 69-98, January 1986.
Development of Customized Shear Layers on Smooth and Rough Surfaces (P. M. Ligrani), International Journal of Heat and Fluid Flow , Vol. 7, No. 4, pp. 266-277, December 1986.
A Reynolds Analogy for Real Component Surface Roughness, (B. J. Belnap, J. A. van Rij, and P. M. Ligrani), International Journal of Heat and Mass Transfer, Vol. 45, No. 15, pp. 3089-3099, July 2002.
Analysis and Experiments on Three-Dimensional, Irregular Surface Roughness, (J. A. van Rij, B. J. Belnap, and P. M. Ligrani), ASME Transactions-Journal of Fluids Engineering, Vol. 124, No. 3, pp. 671-677, September 2002.
Determination of Rough-Surface Skin Friction Coefficients from Wake Profile Measurements, (Qiang Zhang, S. W. Lee, and P. M. Ligrani), Experiments in Fluids , Vol. 35, No. 6, pp. 627-635, December 2003.
Effects of Surface Roughness and Turbulence Intensity on the Aerodynamic Losses Produced by the Suction Surface of a Simulated Turbine Airfoil, (Q. Zhang, S. W. Lee, and P. M. Ligrani), ASME Transactions-Journal of Fluids Engineering , Vol. 126, No. 2, pp. 257-265, March 2004.
Effect of Surface Roughness and Freestream Turbulence on the Wake Turbulence Structure of a Symmetric Airfoil (Q. Zhang, S. W. Lee, and P. M. Ligrani), Physics of Fluids, Vol. 16, No. 6, pp. 2044-2053, June 2004.
Mach Number/Surface Roughness Effects on Symmetric Transonic Turbine Airfoil Aerodynamic Losses (Q. Zhang, and P. M. Ligrani), AIAA Journal of Propulsion and Power, Vol. 20, No. 6, pp. 1117-1125, November-December 2004.
Influence of Mach Number and Freestream Turbulence Intensity on the Aerodynamic Losses of a Turbine Vane (Q. Zhang, D. Sandberg, P. M. Ligrani), AIAA Journal of Propulsion and Power, Vol. 21, No. 6, pp. 988-996, November-December 2005.
Aerodynamic Losses of a Cambered Turbine Vane: Influences of Surface Roughness and Freestream Turbulence Intensity (Q. Zhang, and P. M. Ligrani), ASME Transactions-Journal of Turbomachinery, Vol. 128, No. 3, pp. 536-546, July 2006.
Wake Turbulence Structure Downstream of a Cambered Airfoil In Transonic Flow: Effects of Surface Roughness and Freestream Turbulence Intensity (Q. Zhang, and P. M. Ligrani), International Journal of Rotating Machinery, Vol. 2006, ID: 60234, pp. 1-12, July 2006.