– Impingement Cooling
– Impingement Jet Array Heat Transfer With Surface Textures
– Surface Roughness Characterization and Analysis
– Dimple Surface Arrays
– Swirl Chambers
– Surface Heat Transfer Augmentation Within Internal Passages
– Film Cooling
– Full-Coverage Film Cooling
– Double Wall Cooling
– Second Law Analysis of Film Cooling
– Aerodynamic Losses From Turbine Airfoils
– Transonic Turbine Blade Tips
– Transonic Turbine Blade Tips With Film Cooling
– Transonic Turbine Alloy Blades
– Supersonic Flow Experimental Results
– Shock Wave Unsteady Interactions
– Viscous Dissipation Within a Transonic Flow Environment
– Transitional Flows in Curved Channels
– Dean Flow Dynamics in Low-Aspect Ratio Spiral Microchannels
– Unsteady Laminar Impinging Slot Jets
– Electronics Cooling
– Miniature and Micro-Scale Pumps
– Slip Rarefaction Phenomena
– Elastic Instabilities
– Buoyancy-Driven Continuous SPLITT Fractionation
TRANSONIC TURBINE BLADE TIPS
Transonic Turbine Blade Tips
REFERENCES:
Transonic Turbine Blade Tip Aero-Thermal Performance with Different Tip Gaps: Part II-Tip Aerodynamic Loss (D. O. O’Dowd, Q. Zhang, I. Usandizaga, L. He, and P. M. Ligrani), Paper Number GT2010-22780, TURBO EXPO 2010 – 55th ASME Gas Turbine Technical Congress and Exposition, Glasgow, Scotland, UK, June 14-18, 2010.
Comparison of Heat Transfer Measurement Techniques on a Transonic Turbine Blade Tip (D. O’Dowd, Q. Zhang, L. He, P. M. Ligrani, and S. Friedrichs), ASME Transactions-Journal of Turbomachinery, Vol. 133, No. 2, pp. 021028-1 to 021028-10, April 2011.
Aerothermal Performance of a Winglet at Engine Representative Mach and Reynolds Numbers (D. O. O’Dowd, Q. Zhang, L. He, M. L. G. Oldfield, P. M. Ligrani, B. C. Y. Cheong, and I. Tibbott), ASME Transactions-Journal of Turbomachinery, Vol. 133, No. 4, pp. 041026-1 to 041026-8, October 2011.
Transonic Turbine Blade Tip Aerothermal Performance with Different Tip Gaps – Part I: Tip Heat Transfer (Q. Zhang, D. O. O’Dowd, L. He, M. L. G. Oldfield, and P. M. Ligrani), ASME Transactions-Journal of Turbomachinery, Vol. 133, No. 4, pp. 041027-1 to 041027-9, October 2011.
Overtip Shock Wave Structure and Its Impact on Turbine Blade Tip Heat Transfer, (Q. Zhang, D. O’Dowd, L. He, A. P. S. Wheeler, P. M. Ligrani, and B. C. Y. Cheong), ASME Transactions-Journal of Turbomachinery, Vol. 133, No. 4, pp. 041001-1 to 041001-8, October 2011.
Recent Research Developments for Turbine Blade Tip Heat Transfer, Including Development and Effects of Tip Leakage Vortices (H. Collopy, M. Sampson, and P. M. Ligrani), Invited Plenary Keynote Paper, HMTHSF-2019, Seventh International Conference “Heat and Mass Transfer and Hydrodynamics in Swirling Flows,” National Committee on Heat and Mass Transfer of the Russian Academy of Sciences, Rybinsk, Russian Federation, October 16-18, 2019.
Recent Research Developments for Turbine Blade Tip Heat Transfer, Including Development and Effects of Tip Leakage Vortices (H. Collopy, M. Sampson, and P. M. Ligrani), AIP Conference Proceedings, HEAT AND MASS TRANSFER AND HYDRODYNAMICS IN SWIRLING FLOWS (HMTHSF-2019): Proceedings of the Seventh International Conference (Editors: Alexander I. Leontiev, Yuriy A. Kuzma-Kichta, Shota A. Piralishvili, Sergey V. Veretennikov and Oleg A. Evdokimov), Vol. 2211, Paper No. 020002, AIP Publishing, American Institute of Physics, Melville, New York, USA, March 2020.
Over-Tip Shock Wave Structure and Its Impact on Turbine Blade Tip Heat Transfer
ABSTRACT
In this paper, the transonic flow pattern and its influence on heat transfer on a high-pressure turbine blade tip are investigated using experimental and computational methods. Spatially-resolved heat transfer data are obtained at engine representative conditions (Mexit=1.0, Re=1.27×10⁶) using the transient infrared thermography technique within the Oxford High Speed Linear Cascade research facility. CFD predictions are conducted using the Rolls-Royce HYDRA/PADRAM suite. The CFD solver is able to capture most of the spatial heat flux variations and gives prediction results which compare well with the experimental data. The results show that the majority of the blade tip experiences a supersonic flow with a local peak Mach numbers reaching 1.8. Unlike other low speed data in the open literature, the turbine blade tip heat transfer is greatly influenced by the shock wave structure inside the tip gap. Oblique shock waves are initiated near the pressure side edge of the tip, prior to being reflected multiple times between the casing and the tip. Supersonic flow within the tip gap is generally terminated by a normal shock near the exit of the gap. Both measured and calculated heat transfer spatial distributions illustrate very clear stripes as the signature of the multiple shock structure. Overall, the supersonic part of tip experiences noticeably a lower heat transfer than that near the leading-edge where the flow inside the tip gap remains subsonic.
INTRODUCTION
The tip flow of an unshrouded blade in a high-pressure (HP) turbine can lead to very high levels of heat load to the blade tip. This makes the blade tip highly vulnerable to thermal damage because of the difficulty of applying cooling in this region. At engine-scale conditions a large proportion of the tip flow can be transonic (Moore & Elward [1], Wheeler et al [2]]), and this means that shock waves form within the tip gap, creating large local pressure gradients which significantly affect the boundary-layer development on the tip. However, the effect that this shock structure has on the tip heat transfer is not well understood. To-date this problem has largely been overlooked since a substantial amount of research on tip heat transfer has been performed at subsonic conditions where shock waves are not present. The lack of experimental data at engine-scale conditions is thus rather worrying and experimental data coupled with validated computational models are urgently needed by the gas turbine industry to develop durable and efficient blade tip configurations and tip cooling designs.
A review of high-pressure, high temperature blade tip heat transfer research is presented by Bunker [3]. Early blade tip heat transfer studies include Mayle and Metzger [4], Metzger and Rued [5], Rued and Metzger [6], Chyu et al. [7], Metzger et al. [8], and Yang and Diller [9]. Teng et al. [10] use the transient liquid crystal technique to obtain detailed heat transfer coefficient distributions on a large-scale gas turbine blade under low speed conditions. In a high-speed subsonic linear blade cascade (tip section exit Mach number 0.75), Bunker et al. [11] measure detailed blade tip heat transfer coefficient distributions. Another research associated with high speed subsonic flow is conducted by Azad et al. [12,13], who experimentally investigated heat transfer coefficient and static pressure distributions on a gas turbine blade tip in a five-bladed stationary linear cascade with the peak Mach number of 0.6. Nasir et al. [14] explore the effects of gap height and tip geometry on heat transfer distribution over the tip surface of a HPT first-stage rotor blade.
Numerical investigations on blade tip heat transfer and flow field have been conducted by some research groups. Ameri and Bunker [15] perform a computational study to investigate detailed heat transfer coefficient distributions on blade tip surfaces, their model is also validated with the experimental results by Bunker et al. [11]. Recently, Krishnababu et al. [16] carry out a numerical investigation to study the flow and heat transfer in the tip region. Their numerical code is validated against experimental data conducted by Newton et al. [17] in a low speed incompressible flow
There have been few engine-scale transonic experiments performed, and published in the open literature. Rotating turbine experiments were performed by Thorpe et al. [18], who investigate blade-tip heat transfer using heat flux gauge instrumented on the mean camber line of the blade tip in a transonic rotating turbine. The experimental condition is closely engine-representative and provides data at discrete locations on the blade tip. Dunn and Haldeman [19] present heat-flux measurements for the tip region of a rotating blade with a recessed tip for a full-stage rotating turbine at transonic vane exit conditions. Key and Arts [20] investigate the aerodynamic flow field for flat and squealer tips by oil flow visualizations and static pressure measurements on a transonic blade tip, however, no heat transfer data are obtained.
The present work aims to identify the effect of the tip flow shock structure on the tip heat transfer. An engine representative blade geometry is investigated at engine representative conditions (Mexit=1.0, Re=1.27×10⁶, gap =1.5% chord) using the transient infrared thermography technique in the Oxford High Speed Linear Cascade research facility. Detailed spatially-resolved heat transfer experimental results are used to assess and validate an advanced CFD tool. Both experimental and CFD results have shown some striking features of heat transfer distribution over the tip. Furthermore the detailed CFD analysis has helped elaborate and understand the newly observed phenomena.
NOMENCLATURE
Cx axial chord
h Heat-transfer coefficient [W/m2 K]
k Thermal conductivity [W/m K]
M Isentropic Mach number
PS pressure side surface
q Heat flux [W/m2]
Re Reynolds number
SS Suction side surface
T Temperature
X axial direction
Subscripts
ad Adiabatic
w Wall
in inlet
EXPERIMENTAL FACILITY AND MEASUREMENT TECHNIQUES
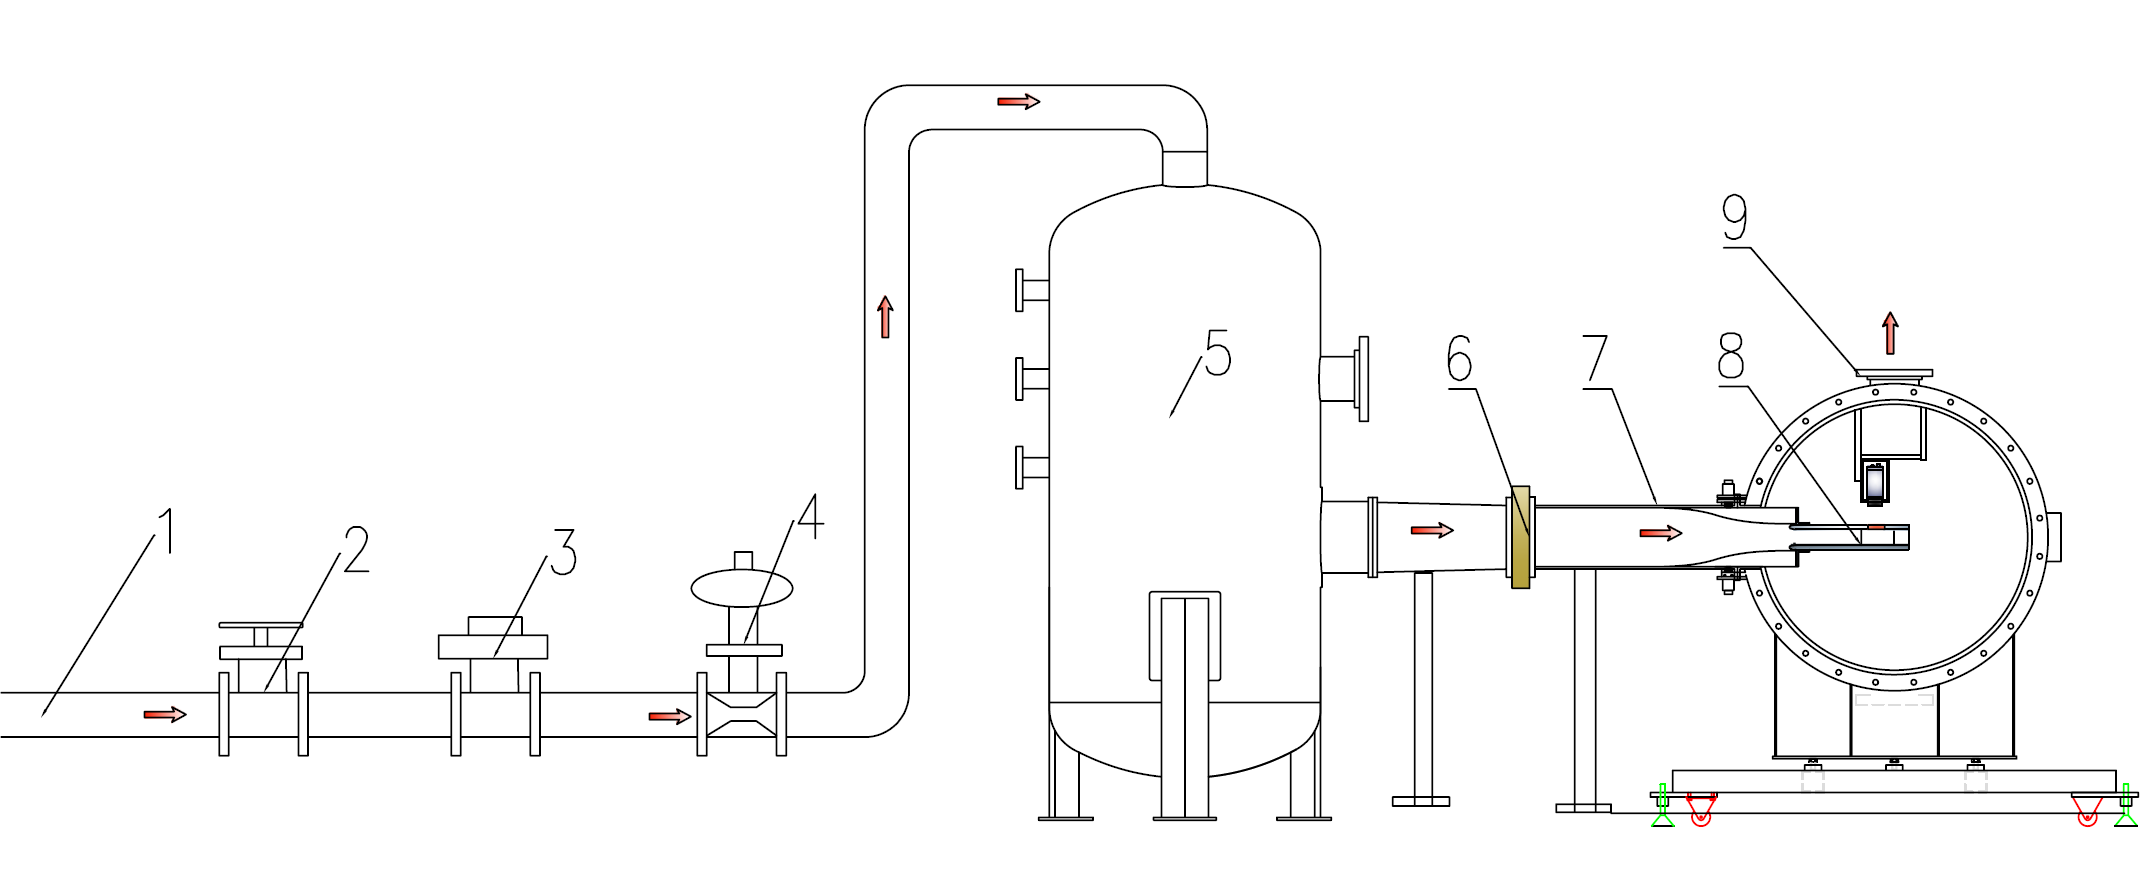
The experiments are conducted in the Oxford high-speed linear cascade facility as shown in Fig. 1. The test section is mounted inside a pressurized plenum, so that Mach number and Reynolds number can be varied independently. Figure 2 shows the details of the test section with 4 passages and 5 blades (including two sidewalls representing a suction side and a pressure side). Boundary layer bleeds are built on all four inlet duct walls, which ensure an appropriate cascade flow condition. One movable tailboard is attached to the suction side sidewall. During the commissioning of the test rig, boundary layer bleeds and tailboard are adjusted to achieve desired blade Mach number distribution and near periodic flow condition. To verify the flow periodicity, a three-hole probe is pitch-wise traversed one axial chord downstream of the test section. Note that the pressure side tailboard is removed due to observations related with the flow periodicity and concerns about shock wave reflections.
A heater mesh element is installed upstream of the test section to provide a step increase in mainstream flow temperature. The heater mesh is described in Gillespie et al [21]. During each blow down test, 100 kW electrical power is employed to the heater mesh to raise the mainstream temperature by 25°C, when operating at 100V. A Zinc-Selenide window is placed on the top casing wall, so that the central test blade tip surface is accessible to an infrared camera (FLIR A325 Researcher) for spatially-resolved surface temperature measurements, as shown in Fig. 2. The FLIR A325 is equipped with a RJ-45 Gigabit Ethernet connection that supplies 16-bit 320×240 images at 60 Hz and linear temperature data.
The blade tip surface is made of epoxy with very low thermal conductivity. The gap between tip and casing is adjustable. Two thermocouples with wire diameter of 0.001 inches are placed on the tip surface. The fast-response of thermocouple enables the in-situ calibration of the infrared camera. Multiple pressure taps are placed on the blade midspan and 95 percent of the span (near tip) to measure the blade issentropic Mach number distributions.
At the inlet to the test section, a pitot-static probe and a total temperature thermocouple are located one axial chord distance upstream of the blades. The PID feedback control system enable a steady flow at the inlet of the test section during every blowdown test. A relatively constant total pressure of 200kpa (absolute) can be maintained for about 90 seconds. A total pressure rake is also used to check the inlet flow uniformity throughout the inlet. Hotwire survey is conducted on axial chord upstream of the test blade to measure the inlet turbulence and inlet casing wall boundary layer profile. The inlet casing wall turbulent boundary layer thickness is about 4mm, as indicated in the velocity profile in Fig. 3. Note that the profile is employed as the inlet casing wall boundary condition of the CFD study presented in the later part of this paper.
A transient thermal measurement technique is employed in the present study. As previously indicated, an abrupt step-change in the mainstream temperature is achieved by the heater mesh installed upstream of the test section. During each blowdown test, the spatially resolved temperature history for the tip surface is recorded into a video file through an Infrared camera. Simultaneously, the temperature readings measured by the thermocouples located on the tip surface are logged into the DAQ system. Figure 4 shows a linear relationship between grayscale values from the Infrared camera video and temperature readings from a surface thermocouple during a blown-down run. Thus, the effects of environmental disturbance, surface characteristics, IR window transmissivity on the IR camera measurement uncertainty are minimized by this in-situ calibration process.
The heat transfer on the blade tip surface is considered to be thorough a semi-infinite solid domain due to the very low conductivity of the tip material. A complete heat flux history is then reconstructed from temperature traces for each blade tip pixel location. Impulse method developed by Oldfield [22], a data processing technique to reconstructs the heat flux from temperature traces, is employed in the present data analysis procedure. This method uses known pairs of exact solutions to obtain in impulse response filter to convert temperature into heat flux using a Fast Fourier Transform. Oldfield [23] describes this process as being much more sophisticated and efficient than other heat flux reconstruction approaches. This method has been employed in the previous study of O’Dowd et al. [24].
Figure 5 shows an example of heat flux reconstructed from the temperature traces (after the heater mesh turned on) versus the wall temperature at one tip pixel location. As expected, a linear relationship between the heat flux and wall temperature is observed. Here, the heat transfer coefficient for the blade tip is defined as,
Therefore, the slope in Fig. 5 is the local heat transfer coefficient, and adiabatic wall temperature can be extrapolated for zero heat flux. This reconstruction method is then used for all the tip surface pixel locations (320×240 IR pixel resolution).
NUMERICAL COMPUTATIONAL DETAILS
The Rolls-Royce HYDRA/PADRAM suite is employed in the present numerical predictions. The core of the software is a preconditioned Runge-Kutta solver of the discrete Euler or Reynolds-averaged Navier-Stokes equations (RANS). In this paper, steady RANS calculations are performed and the Spalart-Allmaras (SA) turbulence model is implemented. The computational domain consists of one blade with periodic boundary conditions. The blade definition, tip gap clearance, flow angle, and inlet boundary conditions are kept exactly same as the experimental setup. The Rolls-Royce PADRAM code has been used for mesh generation. Figure 6 presents the computational domain and mesh employed in the study.
Different wall treatments have been considered in the present study. It is observed that the leading edge flow re-attachment is not well-captured by HYDRA results with “wall function”. Therefore no “wall function” is employed in the present study. The mesh has a multi-block structure, total grid size is about 6.5 million cells. Near tip surface y+ values are approximately 4-5. An isothermal thermal wall boundary condition is employed on all the wall surfaces. Grid sensitivity studies are conducted to make sure that the mesh employed is grid independent in terms of heat flux. Negligible changes are observed when further increasing the grid density.
Visualization of the Hydra solutions has been done using the commercial FieldView software package.
DISCUSSION OF RESULTS
Tip flow structure
The measured and predicted blade Isentropic Mach number ratio (non-dimensionalized by inlet Mach number) distributions at 50% and 95% span are shown in Fig. 7. The midspan experimental data agree very well with 3D CFD predictions by HYDRA. There are some discrepancies between the experimental data and HYDRA predictions for the near tip region around the area of x/Cx =0.5~0.7. This is in the region of the tip leakage flow re-attachment.
Experimental and CFD results suggest that the flow over the first 30%Cx of the blade is subsonic. In-fact this is also true in the tip. The predicted Mach number distribution (determined by local total and static pressures) along a cut plane in the middle of the tip gap clearance is presented in Fig. 8. The peak Mach number in the tip gap flow is about 1.8. The dark contour lines indicate locations for Mach=1. The majority of the blade tip experiences transonic flow. Near the leading-edge of the blade tip, the flow is subsonic, while downstream of 30-40%Cx the flow is supersonic, and is greatly affected by the presence of shocks.
Figure 9 presents tip leakage flow streamlines on a contour of tip surface pressure distribution. Indicated by red color, some streamlines in a region just downstream of the leading edge change directions and travels towards the axial direction. There are also some streamlines on the tip leakage flow (indicated by blue color in Fig. 9) actually coming from the suction side.
Tip heat transfer
Figure 10 presents a contour plot of experimentally measured heat transfer coefficient (h) on the blade tip. It can clearly be seen that the heat transfer coefficients in the first half of the blade tip near the leading edge, are substantially higher than in the second half, over the aft portion of the tip. This is in contrast to the subsonic tip flow described by Bunker et al. [10], amongst others, who have shown a “sweet spot” of low heat transfer over the front portion of the tip. The heat transfer coefficients are roughly 50% higher than the average in region Y, near the leading-edge. (Note: some flow disturbance caused by two thermocouples placed on the tip can be seen in this region.)
Figure 10 also shows stripes of low heat transfer coefficients around the middle of the tip surface (marked X). These stripes are normal to the flow direction, and extend to the trailing edge region. These are due to shock interactions with the tip, which will be demonstrated next. A stripe of low heat transfer coefficient region is also observed in the region of the pressure side edge due to the presence of a separation bubble (marked S). There is also a band of higher heat transfer coefficient region after the separation bubble (marked R) due to the reattachment of this bubble. A small region of high heat transfer coefficients locates close to the trailing-edge (marked Z), which in the engine environment will be very difficult to cool.
It is worth comparing these observations to the high resolution low-speed / subsonic work of Newton et al. [16]. They reported that the maximum heat transfer coefficient on the blade tip occurs in the region of bubble reattachment, which lies essentially along a line parallel to the pressure-side rim. It is clear from these results that, at engine-scale speeds, the highest heat transfer is not found in this reattachment region. Although the heat transfer is high in the reattachment region, the highest heat transfer coefficient occurs in the leading edge region.
Figure 11a presents a contour of adiabatic wall temperature (Tad) for the blade tip surface. The distribution of adiabatic wall temperature follows the pattern of the tip Mach number distribution (see Fig. 8). Figure 11b shows a snap shot of tip surface temperature distribution at the 8th second after heater mesh is turned on. This temperature contour is directly captured by the infrared camera. Note that two clear stripes around the middle of the tip surface are shown both in both Fig. 11a and 11b. Temperature field in Fig. 11b is expected to be approaching Fig. 11a provided the mainstream flow is heated for a longer time (so it is near steady state).
Experimental results from other tip gap clearances also shows consistent data trend. Interesting stripes and variations of temperature field are observed on the tip surface from the infrared video file. These different observations between the present study and previous literature (mostly low speed) should be linked to tip flow structure changes. Further interpretation of the heat transfer results at hands needs more understanding of the flow field above the blade tip under the current transonic flow condition, which leads to the CFD virtual experiment efforts in the present study.
Figure 12 presents the computationally predicted surface heat transfer coefficient distribution over the blade tip. The heat transfer coefficient is obtained by extrapolation from two computational results with different iso-thermal wall temperatures. Compared with the experimental result shown in Fig. 10, the overall trends and variations are very similar. Two stripes with low heat transfer coefficients are also clearly observed around the middle of the tip surface. Circumferential averaged heat flux data for results from both experiments and CFD are presented in Fig. 13. Note that there is a relatively large discrepancy near the trailing edge between CFD and experiments. The flow in this region is highly unsteady, therefore proper accurate measurements are more difficult to obtain. This is also a challenging area for the steady mode CFD as used here.
Figure 14a presents a HYDRA heat flux contour. For the purpose of further comparison and validation, the experimental surface heat flux is calculated from heat transfer coefficients and adiabatic wall temperatures obtained from the experimental data by assuming the same constant wall temperature as employed in CFD. The calculated experimental results are then plotted in Fig. 14b. Again, Figures 14a and 14b show largely similar trends and variations. Spatial variations of heat flux are shown at similar locations on the tip in both figures.
Effect of shock wave structure on surface heat transfer
To further investigate the cause of the heat flux stripes, a virtual Schlieren visualization is conducted by placing four cut planes on the blade tip surface along leakage flow streamlines direction, as shown in Figure 15. In this contour plot, heat flux distribution is still shown on the blade tip surface by color scale. X-components of density gradient distributions are presented for the four cut planes in grey scale. Clearly the variations of heat flux correspond to those flow features associated with the shock system. The stripes in the heat flux contour are linked to shock waves reflected within the tip gaps.
Near the pressure side corner, the flow accelerates and an oblique shock wave originates near the separation bubble. This is observed from all four cut planes. (Compared with typical low speed data from the literature, the separation bubble size at the present transonic condition is much smaller due to the existence of shock waves.) The flow continues to accelerate after the reflections of the oblique shock wave between the casing and the tip. A normal shock wave is generated immediately afterwards as the flow passes the blade tip gap.
There are two main mechanisms which affect the local heat transfer coefficient on the tip. These are firstly shear, which is largely set by the boundary layer thickness, and secondly turbulent mixing, which will be effected by local streamwise pressure gradient. In the reattachment after the separation bubble near the pressure side corner, the heat transfer levels are high because the separation promotes turbulence production. Downstream of the reattachment, the flow is supersonic and accelerates rapidly thus causing a reduction in turbulence which reduces the heat transfer. Under the oblique shock reflection from the tip, the boundary-layer experiences a large adverse pressure gradient which leads to a considerable increase in turbulence generation. Thus, there is a rapid increase in heat transfer across the shock. This pattern of high and low heat transfer stripes, normal to the flow direction, are therefore due to the rapid acceleration and deceleration which occur prior to and across the shock reflections on the tip, which thus dominate the turbulence production and dissipation.
Effect of casing motion
It has been reported that relative casing motion will make some differences on the tip leakage flow and heat transfer to the blade. Here, no attempt has been made to fully address the moving casing motion effect since it exceeds the scope of the present study. Figure 16 presents the local Mach number distribution along a cut plane in the middle of the tip gap clearance with a moving casing wall. It can be observed that this relative casing motion does create some local variations on the Mach number distribution, compared with results shown in Fig. 8. However, it does not change the transonic nature of the tip leakage flow. The shock wave reflection mechanism still exists.
SUMMARY AND CONCLUSIONS
This paper is aimed to study the effect of the over-tip shock wave pattern on heat transfer within an engine-scale HP turbine blade. The heat transfer and flow for an engine-scale blade tip were experimentally and computationally investigated using the new Oxford High Speed Linear Cascade rig and the Rolls-Royce HYDRA/PADRAM codes. The RANS solver with the Spalart-Allmaras one-equation turbulence model is shown to be able to capture most of the spatial heat transfer variations and gives computational results which compare remarkably well with the experimental data.
The experimental and numerical results reveal that, at engine-scale conditions, the majority of the tip flow (apart from the leading edge region) experiences a transonic flow with peak Mach numbers of up to 1.8. In the supersonic tip flow, an oblique shock wave initiates around the pressure side edge and is reflected between the casing and the tip. A normal shock wave is generated before the leakage flow exits the tip gap. Thus the tip flow is greatly affected by shock waves within the gap, which create large local variations in the heat transfer. The signatures of the multiple reflected shock wave pattern can be clearly seen as stripes with high and low heat transfer. The stripes are caused by the rapid supersonic acceleration prior to the oblique shock reflection, which reduces the heat transfer, and across the shock reflection the large adverse pressure gradient causes a rise in turbulence production which rapidly raises the heat transfer.
The influence of the relative casing motion is also examined in the computational study. The moving casing does lead to a reduced leakage flow and alter the local Mach number distribution in the tip. However, a large portion of the tip remains transonic with similar shock structures.
The results of the present combined experimental and computational study suggest that future blade-tip designs need to focus on both the pressure-side edge separation and the shock-structure within the tip. This is especially true if tip heat loads and thermal gradients are to be minimized.
REFERENCES
[1] Moore, J. and Elward, K. M., 1993, “Shock formation in Overexpanded tip leakage flow,” ’’ ASME J. Turbomach., 115, pp. 392-399.
[2] Wheeler, A. P. S., Atkins, N. R., and He, L., 2009, “Turbine Blade Tip heat Transfer in Low Speed and High Speed Flows,” Proceedings of ASME Turbo Expo 2009, Orlando, Florida, USA, GT2009-59404.
[3] Bunker, R.S., 2001, “A Review of Turbine Blade Tip Heat Transfer in Gas Turbine Systems”, Annals of the New York Academy of sciences, New York, 934, pp. 64-79
[4] Mayle, R. E., and Metzger D. E., 1982, ‘‘Heat Transfer at the Tip of an Unshrouded Turbine Blade,’’ Proc. Seventh Int. Heat Transfer Conf., Hemisphere Pub., pp. 87–92.
[5] Metzger, D. E., and Rued, K., 1989, ‘‘The Influence of Turbine Clearance Gap Leakage on Passage Velocity and Heat Transfer Near Blade Tips: Part I—Sink Flow Effects on Blade Pressure Side,’’ ASME J. Turbomach., 111, pp. 284–292.
[6] Rued, K., and Metzger, D. E., 1989, ‘‘The Influence of Turbine Clearance Gap Leakage on Passage Velocity and Heat Transfer Near Blade Tips: Part II—Source Flow Effects on Blade Suction Sides,’’ ASME J. Turbomach., 111, pp. 293–300.
[7] Chyu, M. K., Moon, H. K., and Metzger, D. E., 1989, ‘‘Heat Transfer in the Tip Region of Grooved Turbine Blades,’’ ASME J. Heat Transfer, 111, pp.131–138.
[8] Metzger, D. E., Dunn, M. G., and Hah, C., 1991, ‘‘Turbine Tip and Shroud Heat Transfer,’’ ASME J. Turbomach., 113, pp. 502–507.
[9] Yang, T. T., and Diller, T. E., 1995, ‘‘Heat Transfer and Flow for a Grooved Turbine Blade Tip in a Transonic Cascade,’’ ASME Paper No. 95-WA/HT-29.
[10] Teng, S., Han, J.C., & Azad, G.M.S. 2001, “Detailed heat transfer coefficient distributions on a large-scale gas turbine blade tip”, Journal of Heat Transfer, vol. 123, no. 4, pp. 803-809.
[11] Bunker, R.S. Bailey, J.C., & Ameri, A.A. 2000, “Heat transfer and flow on the first-stage blade tip of a power generation gas turbine: Part 1–experimental results”, Journal of Turbomachinery, vol. 122, no. 2, pp. 263–271.
[12] Azad, G. M. S., Han, J. C., Teng, S., and Boyle, R., 2000, ‘‘Heat Transfer and Pressure Distributions on a Gas Turbine Blade Tip,’’ ASME J. Turbomach., 122, pp. 717–724.
[13] Azad, G.S., Han, J. & Boyle, R.J. 2000, “Heat transfer and flow on the squealer tip of a gas turbine blade”, Journal of Turbomachinery, vol. 122, no. 4, pp. 725-732.
[14] Nasir, H., Ekkad, S.V., Kontrovitz, D.M., Bunker, R.S. & Prakash, C. 2004, “Effect of tip gap and squealer geometry on detailed heat transfer measurements over a high pressure turbine rotor blade tip”, Journal of Turbomachinery, vol. 126, no.2, pp. 221-228.
[15] Ameri, A. A., and Bunker, R. S., 2000, ‘‘Heat Transfer and Flow on the First Stage Blade Tip of a Power Generation Gas Turbine: Part 2—Simulation Results,’’ASME J. Turbomach., 122, pp. 272–277.
[16] Krishnababu, S.K., Newton, P.J., Dawes, W.N., Lock, G.D., Hodson, H.P., Hannis, J. and Whitney, C., 2009, “Aero-thermal investigation of tip leakage flow in axial turbines. Part 1: effect of tip geometry and tip clearance gap”, ASME J. Turbomach., 131, 011006-1-14.
[17] Newton, P.J., Krishnababu, S.K., Lock, G.D., Hodson, H.P., Dawes, W.N., Hannis, J. & Whitney, C. 2006, “Heat transfer and aerodynamics of turbine blade tips in a linear cascade”, Journal of Turbomachinery, vol. 128, no. 2, pp. 300-309.
[18] Thorpe, S.J., Yoshino, S., Thomas, G.A., Ainsworth, R.W. and Harvey, N.W. 2005, “Blade-tip heat transfer in a transonic turbine”, Proceedings of the Institution of Mechanical Engineers, Part A: Journal of Power and Energy, vol. 219, no. 6, pp. 421-430.
[19] Dunn M. G. and Haldeman, C. W., 2000, “Time-averaged heat flux for a recessed tip, lip, and platform of a transonic turbine blade,” Journal of Turbomachinery, vol. 122, pp. 692-698.
[20] Key, N.L, & Arts, T. 2006, “Comparison of turbine tip leakage flow for flat tip and squealer tip geometries at high-speed conditions”, Journal of Turbomachinery, vol. 128, no. 2, pp. 213-220.
[21] Gillespie, D.R.H, Wang, Z. & Ireland, P.T. 1995, “Heating element”, British Patent Application PCT/GB96/2017
[22] Oldfield, M.L.G., Jones, T.V. & Schultz, D.L. 1978, “On-line computer for transient turbine cascade instrumentation”, IEEE Transactions on Aerospace and Electronic Systems, vol. AES 14, no. 5, pp. 738 749.
[23] Oldfield, M.L.G. 2008, “Impulse response processing of transient heat transfer gauge signals”, Journal of Turbomachinery, vol. 130, no. 2, pp. 021023-1-9
[24] O’Dowd D., Zhang Q., Ligrani P., He L., Friedrichs S. 2009, “Comparisons of Heat Transfer Measurement Techniques on a Transonic Turbine Blade Tip”, ASME Turbo Expo 2009, GT2009-59376.
- Air from a 30m3 Storage tank, 400psi 2. Gate valve 3. air operated actuator
- Spirax Sarco control valve/pressure controller/positioner 5. Inlet Plenum
- Heater mesh 7. Transition duct 8. Test section 9. Exit plenum
Figure 1 Schematic of the Oxford high speed linear cascade facility.
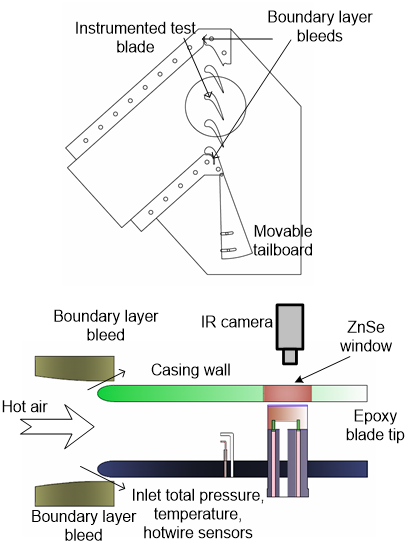
Figure 2 Schematic of the test section.
Figure 3. Inlet casing wall boundary layer profile measured one axial chord upstream of the test blade.
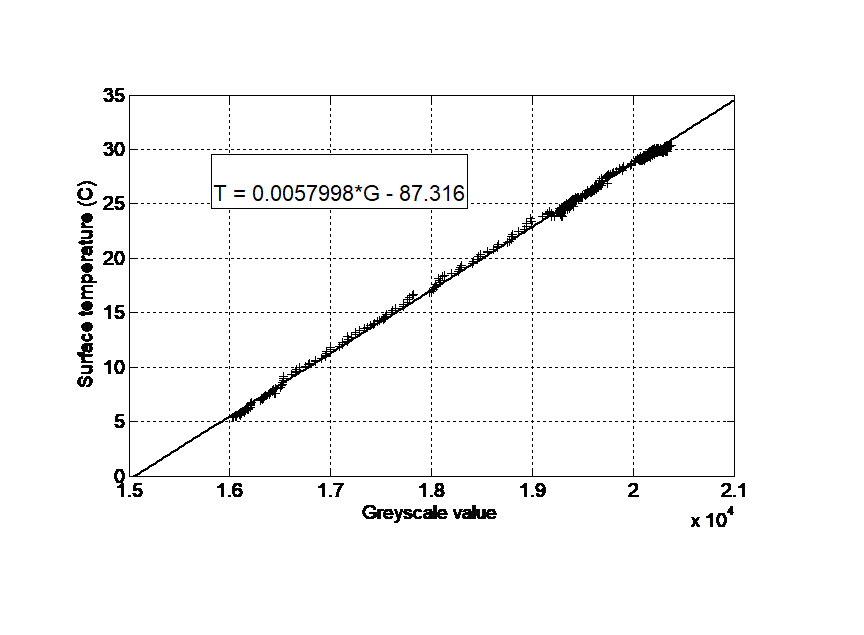
Figure 4 Infrared camera in-situ calibration during a blow-down run.
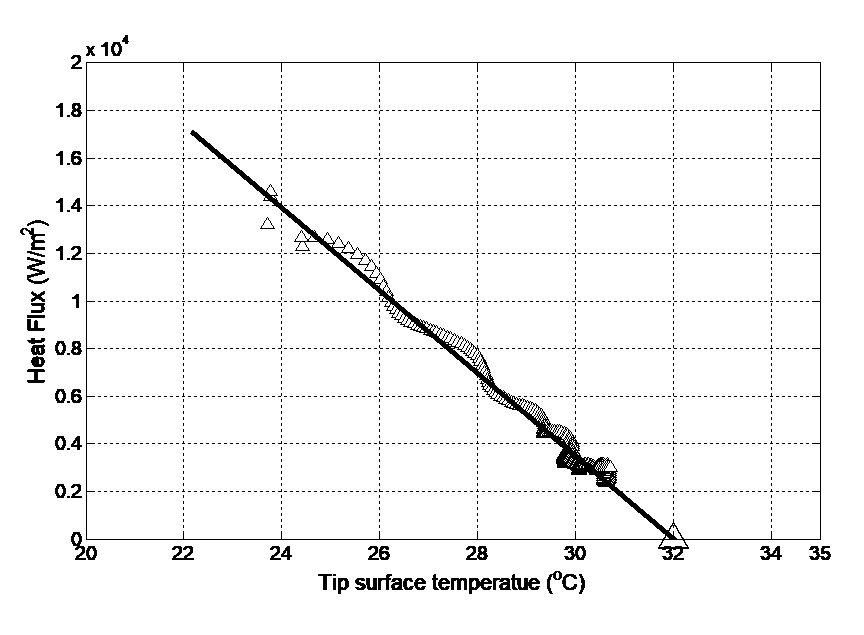
Figure 5 An example of heat flux versus temperature history at one location on the tip surface.
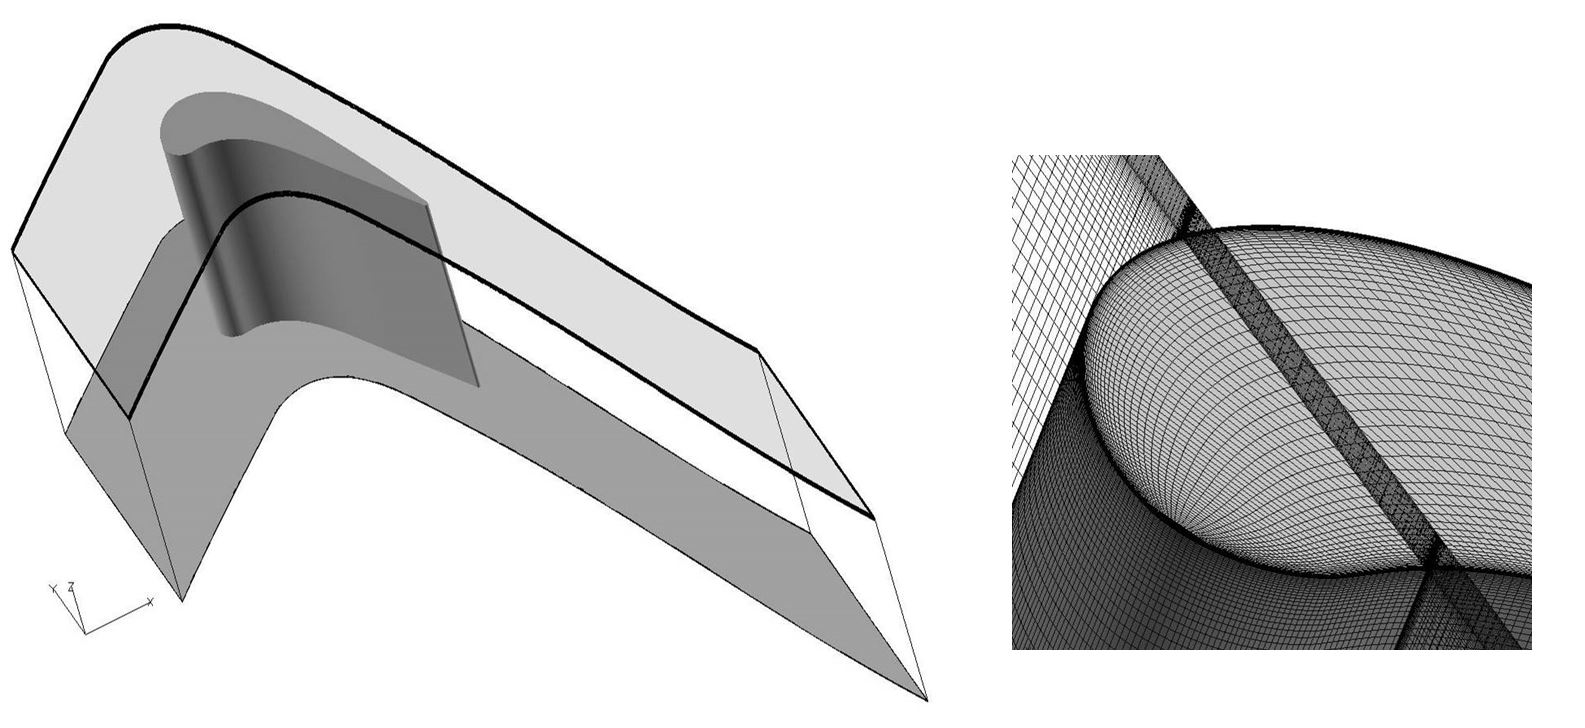
Figure 6 Computational domain and mesh employed in the present study.
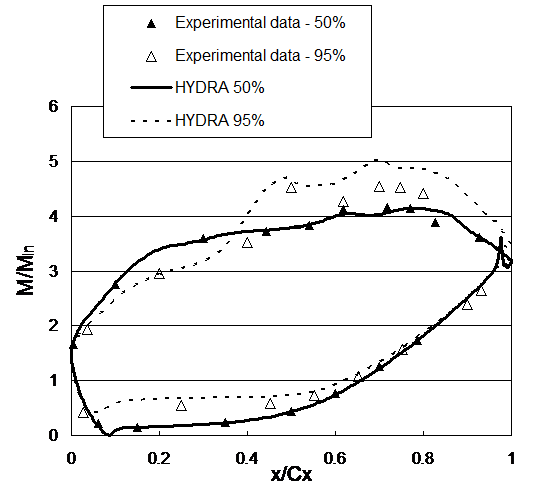
Figure 7 Isentropic Mach number ratio (M/Min) distribution along the blade midspan and near tip region.
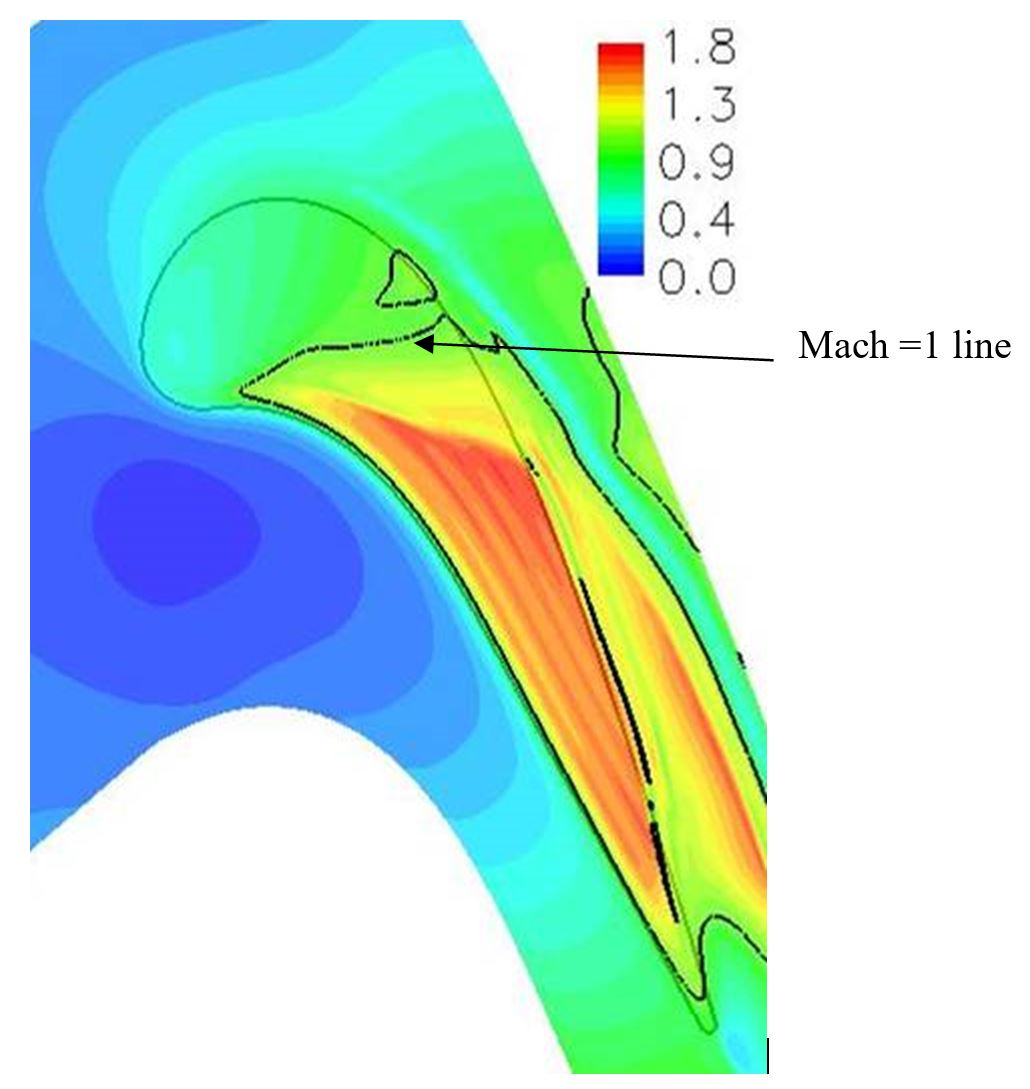
Figure 8 Local Mach number distribution along a cut plane in the middle of the tip gap clearance. (HYDRA)
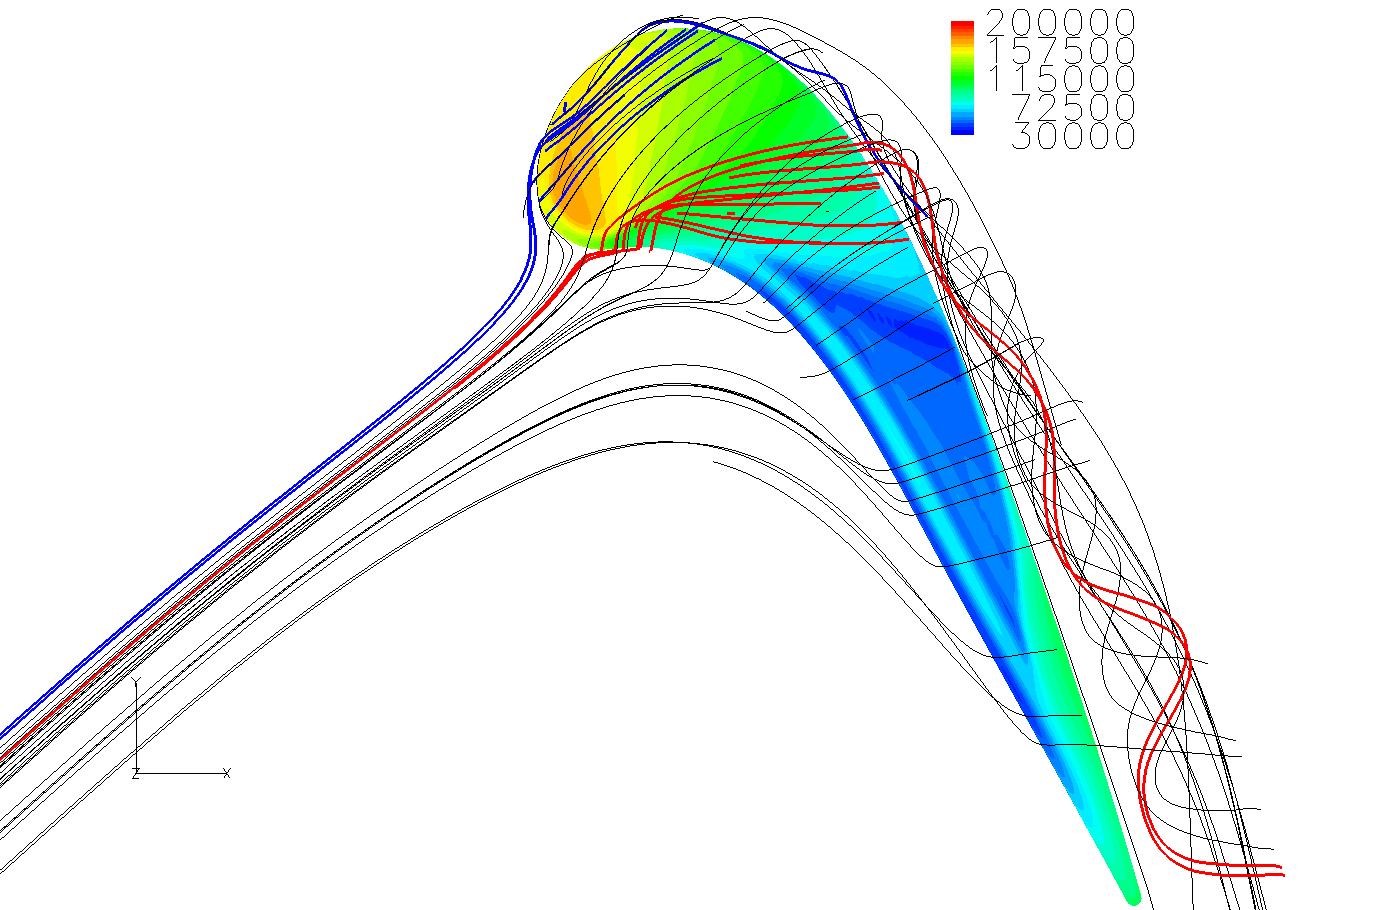
Figure 9 Tip leakage flow streamlines on a contour of tip surface pressure distribution (HYDRA).
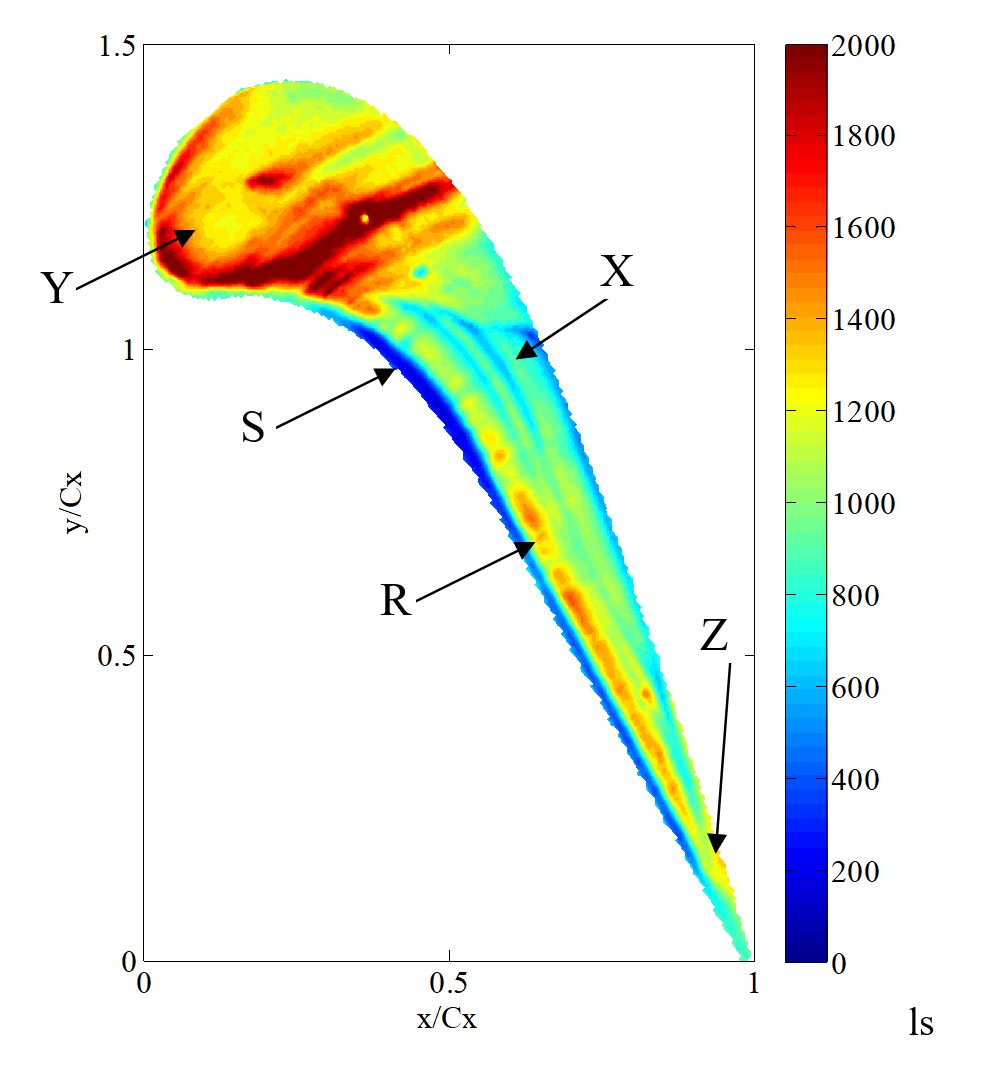
Figure 10 Experimentally measured contours of heat transfer coefficient on a blade tip. (w/m2k)
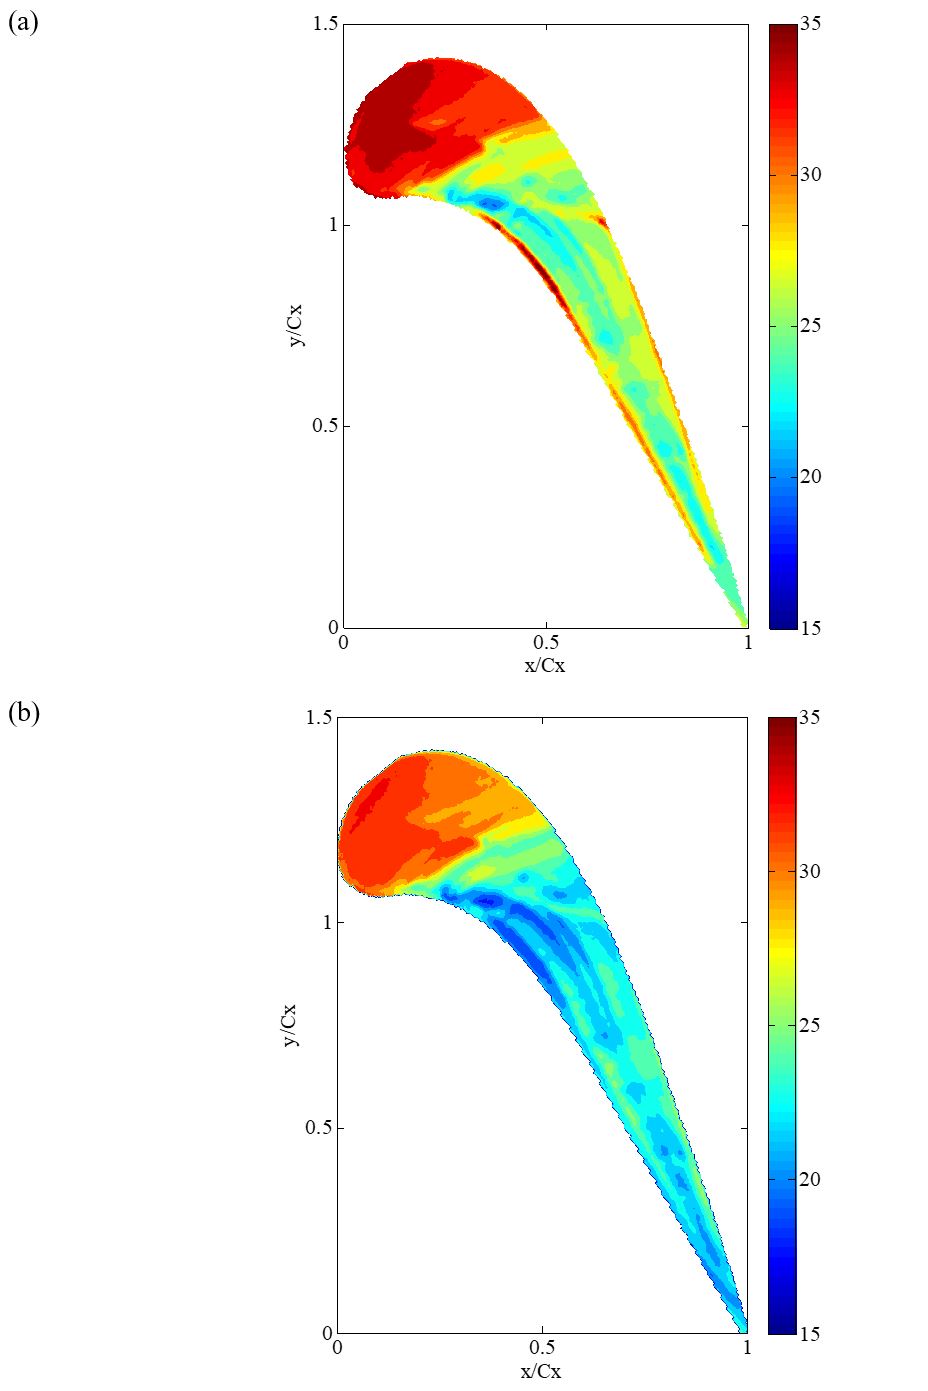
Figure 11 Experimentally measured contours of (a) adiabatic wall temperature, and (b) tip surface temperature 8 seconds after heater mesh is turned on.
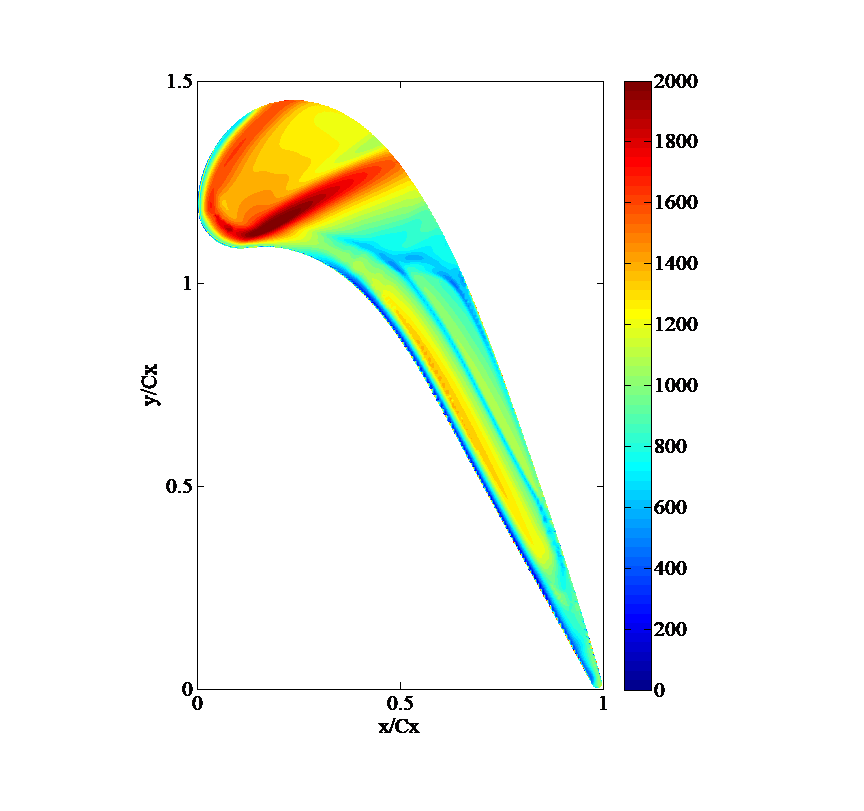
Figure 12 Contours of heat transfer coefficient on a blade tip predicted by HYDRA. (w/m2k)
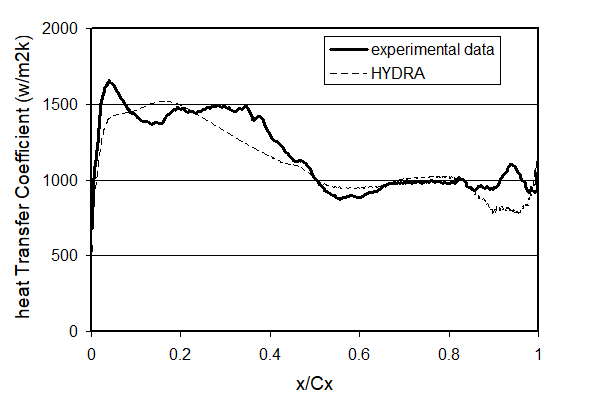
Figure 13 Comparisons of circumferential averaged heat transfer coefficient between experiment and HYDRA.
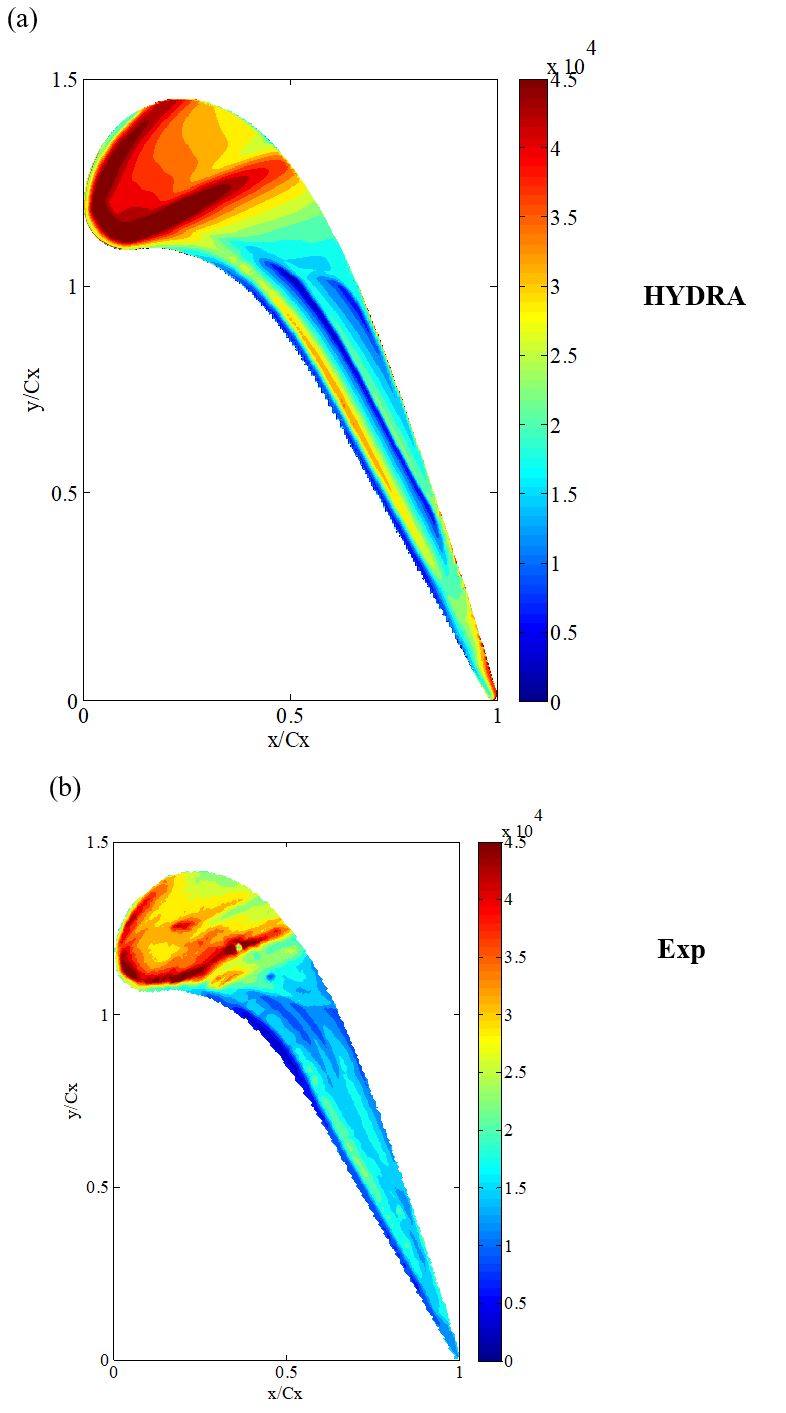
Figure 14 Heat flux contour obtained from (a) HYDRA, and (b) experiment.
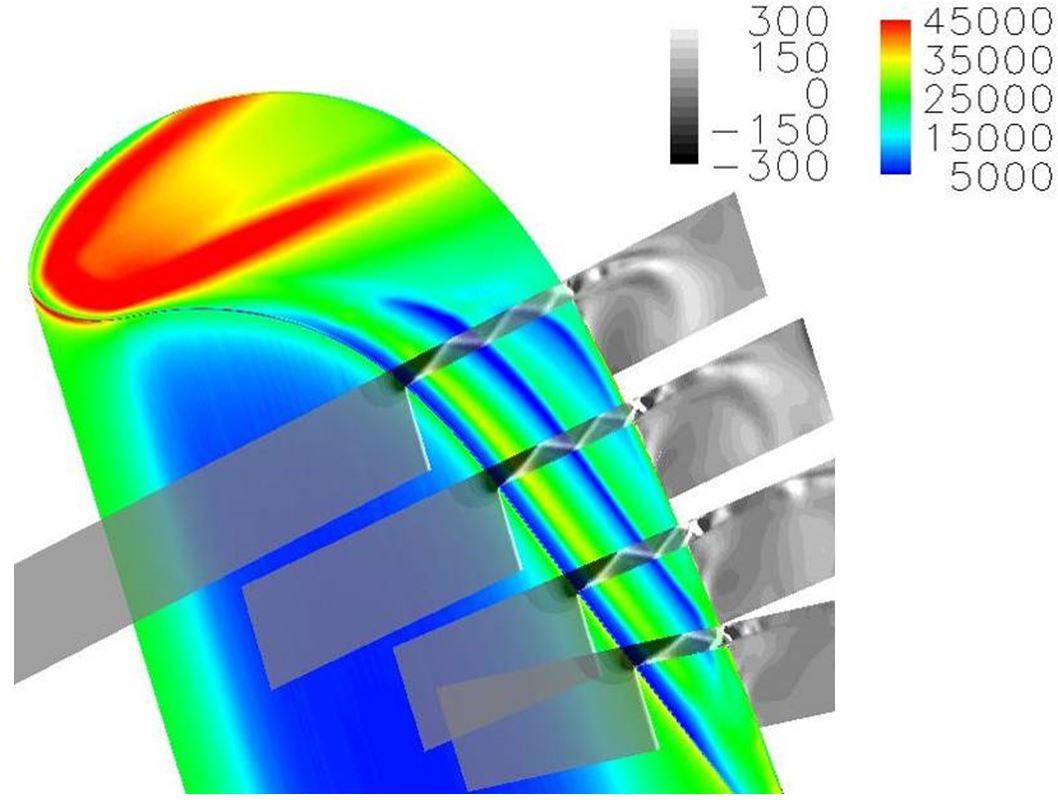
Figure 15 Tip surface heat flux and X-components of density gradient distributions along four cut planes. (HYDRA prediction)
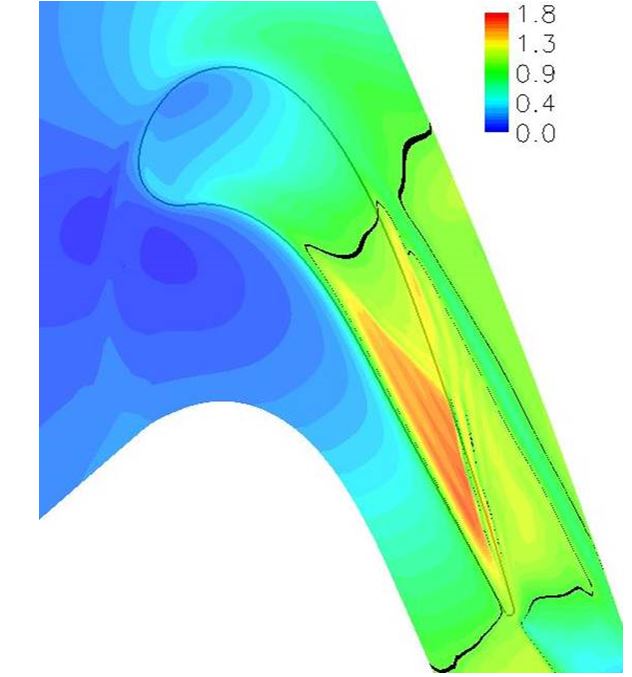
Figure 16 Local Mach number distribution along a cut plane in the middle of the tip gap clearance with a moving casing wall. (HYDRA prediction)