– Impingement Cooling
– Impingement Jet Array Heat Transfer With Surface Textures
– Surface Roughness Characterization and Analysis
– Dimple Surface Arrays
– Swirl Chambers
– Surface Heat Transfer Augmentation Within Internal Passages
– Film Cooling
– Full-Coverage Film Cooling
– Double Wall Cooling
– Second Law Analysis of Film Cooling
– Aerodynamic Losses From Turbine Airfoils
– Transonic Turbine Blade Tips
– Transonic Turbine Blade Tips With Film Cooling
– Transonic Turbine Alloy Blades
– Supersonic Flow Experimental Results
– Shock Wave Unsteady Interactions
– Viscous Dissipation Within a Transonic Flow Environment
– Transitional Flows in Curved Channels
– Dean Flow Dynamics in Low-Aspect Ratio Spiral Microchannels
– Unsteady Laminar Impinging Slot Jets
– Electronics Cooling
– Miniature and Micro-Scale Pumps
– Slip Rarefaction Phenomena
– Elastic Instabilities
– Buoyancy-Driven Continuous SPLITT Fractionation
IMPINGEMENT COOLING
Impingement Cooling
REFERENCE:
Recent Developments in Impingement Array Cooling, Including Consideration of the Separate Effects of Mach Number, Reynolds Number, Temperature Ratio, Hole Spacing, and Jet-to-Target Plate Distance (P. M. Ligrani), Impingement Jet Cooling in Gas Turbines (Editors: R. S. Amano, B. Sunden), WIT Press, Southampton, United Kingdom, Chapter 3, pp. 63-102, 2014.
Abstract
Presented are data which illustrate the separate effects of Mach number, Reynolds number, temperature ratio, hole spacing, and jet-to-target plate distance on surface Nusselt numbers produced by an array of jets impinging on a flat plate. The local and spatially-averaged Nusselt numbers, and local and spatially-averaged recovery factors are unique because: (i) data are obtained at constant Reynolds number as the Mach number is varied, and at constant Mach number as the Reynolds number is varied, (ii) data are obtained at constant Reynolds number and constant Mach number, as the temperature ratio is varied, (iii) data are obtained at constant temperature ratio, Mach number, and Reynolds number, as the impingement hole spacing is varied, and (iv) data are given for jet impingement Mach numbers up to 0.74, and for Reynolds numbers up to 60,000. Also included are crossflow-to-jet mass velocity ratio data and discharge coefficient data. Impingement hole spacings are 5D, 8D, and 12D in the streamwise and spanwise directions, with jet-to-target-plate distance of 3D. Local spatially-resolved and spatially-averaged Nusselt numbers, measured using infrared thermography and energy balance techniques, show strong dependence on the impingement jet Reynolds number for each situation as the jet Mach number is maintained constant. Nusselt numbers show negligible variations with Mach number, between Ma=0.1 and 0.2, however, data taken at Mach numbers greater than 0.2 (as the Reynolds number is held constant) show that Mach number has a significant impact on local and spatially-averaged Nusselt numbers. This Mach number dependence changes with hole spacing, with greater Nusselt number increases with the less dense impingement arrays. These variations are described using new correlations, which account for the effects of Mach number for all three impingement hole spacings. In regard to the effects of temperature ratio, at constant Reynolds number of 18000, and constant Mach number of 0.2, experimental results show that local, line-averaged, and spatially-averaged Nusselt numbers decrease as the Twa/Tj temperature ratio increases. This is believed to be due to the effects of temperature-dependent fluid properties, as they affect local and global turbulent transport in the flow field created by the array of impinging jets. Data which illustrate the effects of jet-to-target plate distance on the heat transfer from an array of jets impinging on a flat plate are presented for a Reynolds number Rej of 8,200. Jet-to-target plate distances Z of 1.5D, 3.0D, 5.0D, and 8.0D are employed. Steamwise and spanwise hole spacings are 8D. Local and spatially-averaged Nusselt numbers show important dependence upon normalized jet-to-target plate distance, especially for smaller values of this quantity. The highest spatially-averaged Nusselt numbers are present for Z/D=3.0 for Rej of 8,200.
1 Introduction
Exposure to hot gasses or hot liquids generates undesirable heat in a wide range of applications. Impingement cooling is an attractive method for the removal of these heat loads because of its relativity high effectiveness. The main objective of impingement cooling is maximum heat removal with minimal coolant mass flow rates. To achieve this, jets of impinging fluid are frequently delivered by orifices integrated into internal structures within the component in need of heat removal. In the example of cooling leading edge regions of turbine blades and vanes, the impingement air enters the leading edge cavity from an adjacent cavity through a series of crossover holes on the partition wall between the two cavities. The crossover jets then impinge on the concave leading-edge wall and then exit either through film cooling holes, or though exit passages which lead to another part of the airfoil. Spanwise lines of impingement jets are produced with this arrangement which direct cooling air on high external heat load regions, such as the stagnation region [1]. Impingement cooling is also often used to cool parts of the combustor in gas turbine engines, including combustion chamber liners, transition pieces, and splash plates. In each case, impinging jets can be used individually or in arrays [2].
The effects of changing impingement plate geometric and configuration parameters, as well as physical parameters in flows with low Mach numbers, incompressible conditions, and relatively low speeds are considered in a variety of existing publications. The effects of Reynolds number and streamwise/spanwise hole spacing in low-speed impingement cooling are addressed by Kercher and Tabakoff [3] and Chance [4]. Metzger et al. [5] and Chupp et al. [6] address heat transfer with a semi-circular concave region with a line of circular jets impinging on the apex addressing the effects of target spacing, hole spacing, and jet Reynolds number. The influences of cross-flow on a single line of jets is examined by Metzger and Korstad [7], showing that target spacing, jet Reynolds number, and the relative strengths of the jet flow and the cross flow influence heat transfer on the target wall. In another paper, Metzger et al. [8] present heat transfer characteristics measured on a target surface beneath a two-dimensional array of impinging jets also in low-speed flow that indicate in-line jet impingement hole patterns provide better heat transfer than staggered arrangements. Florschuetz et al. [9] includes data on channel cross flow mass velocity and jet mass velocity (where ratios range from 0 to 0.8), in addition to a correlation with gives Nusselt number dependence on these parameters, as well as on jet impingement plate geometry, Prandtl number, and Reynolds number. Different cross-flow schemes on impingement heat transfer in low-speed flows are considered by Obot and Trabold [10] who arrive at the conclusion that for a given crossflow scheme and constant jet diameter d, higher heat transfer coefficients are obtained as the number of jets over a fixed target area increases and that progressively lower performance is obtained as the cross-flow is restricted to exit through two opposite sides, and then, through one side of the passage between the impingement hole plate and the target plate. Bunker and Metzger [11] present detailed local heat transfer distributions due to line jet impingement for leading edge regions, both with and without film extraction effects. Fox et al. [12] examine the effects of unsteady vortical structures on the adiabatic wall temperature distribution produced by a single impinging jet. Bailey and Bunker [13] investigate impingement arrays with inline jets in a “square array”, with different axial and lateral jet spacings and relatively low Mach numbers. Included are correlations developed from these data which extend the range of applicability of the correlations presented by Florschuetz et al. [9]. Other recent studies considered the effects of jet impingement on a leading edge/concave wall with roughness [14], and the effects of jets with mist and steam on a concave target surface [15]. Parsons et al. [16,17], Parsons and Han [18], Epstein et al. [19], and Mattern and Hennecke [20] show that rotational effects are important for jets impinging on flat surfaces at relatively low Reynolds numbers. However, there is little or no information available at higher jet Reynolds numbers and jet rotation numbers on concave surfaces relevant to engine conditions. Thus, it is evident that, aside from a few investigations, most of the impingement data from the open literature are obtained on flat, smooth surfaces. Brevet et al. [21] employ flat plates to consider one row of impinging jets in a test section with low speed, incompressible flow in which the spent air is again constrained to exit in one direction. Effects of impingement distance, Reynolds number, and spanwise hole spacing on Nusselt number distributions lead to recommendations for optimal Z/d values of 2 to 5, and optimal spanwise hole spacings of 4 to 5 hole diameters. Brevet et al. [22] describe recovery factors and Nusselt numbers measured on a flat target surface beneath a single, compressible impingement jet. These authors have the distinction of separating the effects of Mach number and Reynolds number. Data sets with different Mach numbers and constant Reynolds number are obtained using different impingement hole plates with different hole diameters. They conclude that, increasing the Mach number (as the Reynolds number is constant) improves impingement heat transfer significantly for jet Mach numbers greater than 0.2.
Other recent studies by Lee et al. [23], Garimella and Nenaydykh [24], and Shuja et al. [25] address the effects of nozzle geometry on heat transfer and fluid flow, whereas Siba et al. [26], Chung and Luo [27], and Abdon and Sundén [28] use experimental and numerical approaches to consider the influences of turbulent impingement jets. In another numerical investigation, Tong [29] investigates the hydrodynamic and heat transfer behavior of circular liquid jets. Laschefski et al. [30] also uses a numerical approach to investigate of heat transfer produced by rows of rectangular impinging jets. Seyedein et al. [31] report heat transfer characteristics from confined multiple turbulent impinging slot jets, and Rhee et al. [32] describe heat transfer, mass transfer, and flow characteristics from arrays of effusion holes.
Although the number of existing impingement cooling studies is considerable, new innovative cooling configurations are being used in gas turbines, which require additional investigation to account for a number of currently unexplored effects and their influence on impingement heat transfer, especially when compressible flow effects are present. Two of the most important of these unexplored areas are the independent effects of Mach number and Reynolds number for an array of impinging jets. The present chapter provides data on these effects for an array of impinging jets in the form of discharge coefficients, local and spatially-averaged Nusselt numbers, and local and spatially-averaged recovery factors. The data are unique, not only because data are given for impingement jet Mach numbers as high as 0.74 and impingement jet Reynolds numbers as high as 60,000, but also because the effects of Reynolds number and Mach number are separated by providing data at constant Reynolds number as the Mach number is varied, and data at constant Mach number as the Reynolds number is varied. As such, the present impingement jet array study can considered a continuation of the investigation of Brevet et al. [22] wherein Mach number influences are investigated for a single impingement jet. Also considered is the effect of increasing wall to jet temperature ratio for an array of cool jets impinging on a heated surface with various flow rates of spent air crossflow. The relationship between the degradation of spatially-averaged Nusselt number and wall to jet temperature ratio is represented as a correlation. Data are given for six different temperature ratios. Also provided are new, compressible flow impingement heat transfer data which illustrate the effects of hole spacing at different Reynolds numbers and Mach numbers. Here, hole spacings of 5D, 8D and 12D are employed. The thickness of each impingement plate is 1D, and the spacing between the hole exit planes and the target plate is 3D. Included are discharge coefficients, crossflow-to-jet mass velocity ratios, as well as line-averaged, and spatially-averaged Nusselt numbers. Data are given which illustrate the separate dependences of local and spatially-averaged Nusselt numbers on jet Mach number and jet Reynolds number, for different hole jet spacings. Different hole spacings result in different interactions between adjacent jets and between jets and wall boundary layers, which, when coupled with compressibility, give different local Nusselt number dependence on Mach number. Data which illustrate the effects of jet-to-target plate distance on the heat transfer from an array of jets impinging on a flat plate are presented for a Reynolds number Rej of 8,200. Jet-to-target plate distances Z of 1.5D, 3.0D, 5.0D, and 8.0D are employed, and the steamwise and spanwise hole spacing is 8D. Associated local and spatially-averaged Nusselt numbers show important dependence upon normalized jet-to-target plate distance, where local variations result from the competing influences of individual jet shear layers, and vortices generated by Kelvin-Helmholtz instabilities.
2 Experimental Apparatus and Procedures
2.1 Impingement flow facility and impingement array plates.
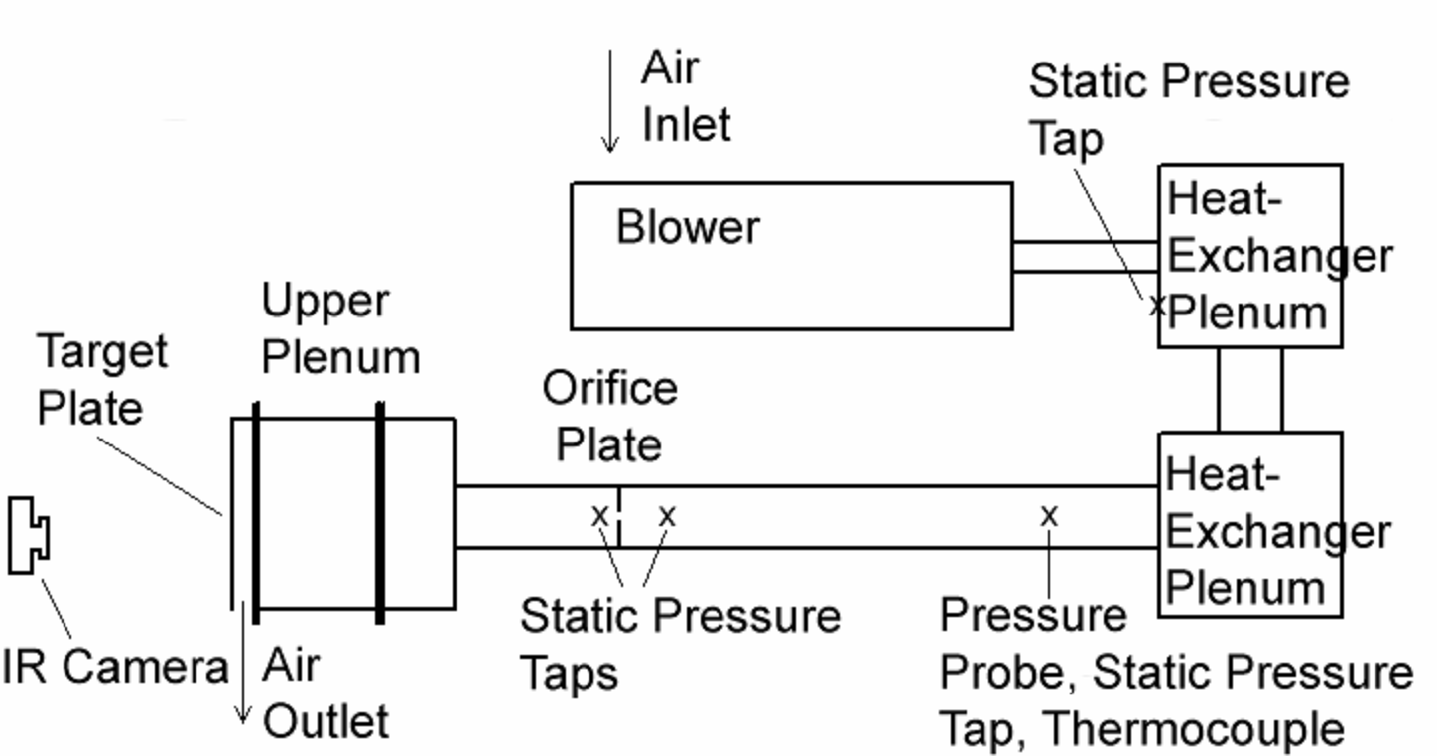
Schematic diagrams of the facility used for heat transfer measurements are presented in Figs. 1a, 1b, and 2. The facility is constructed of 6.1 mm thick ASTM A38 steel plates, and A53 Grade B ARW steel piping, and with the Fig. 1a configuration, is open to the laboratory air at its inlet and exit. Depending upon the required flow conditions, one of two blowers is employed. For the lower Reynolds numbers investigated, a New York Blower Co. 7.5 HP, size 1808 pressure blower is employed. For higher Reynolds numbers, a DRUM Industries, 50 HP, D807 pressure blower is employed. In each case, the air mass flow rate provided to the test section is measured (downstream of whichever blower is employed) using an ASME standard orifice plate, flow-mounted calibrated copper-constantan thermocouples, and Validyne DP15 pressure transducers (with diaphragms rated at 13.8 or 34.5 kPa) connected to DP10D Carrier Demodulators. The blower exits into a series of two plenums arranged in series (the upstream plenum is .63 m to a side and the downstream plenum measures .63 m x .77 m x .77 m). A Bonneville cross-flow heat exchanger is located within the plenum which is farther downstream. As the air exits the heat exchanger, and the second plenum, the air passes into a 0.22 m outer diameter pipe, which contains the ASME Standard orifice plate employed to measure the air mass flow rate [33-37].
This pipe then connects to the 0.635 m by 0.635 m side of a plenum, which is shown in Fig. 2. Upon entering this plenum, the air first encounters a flow baffle used to distribute the flow, a honeycomb, and other flow straightening devices. These are followed by the impingement plenum (or upper plenum, located below the honeycomb and flow straightening devices) whose top dimensions are 0.635 m and 0.635 m, and whose height is 0.40 m.
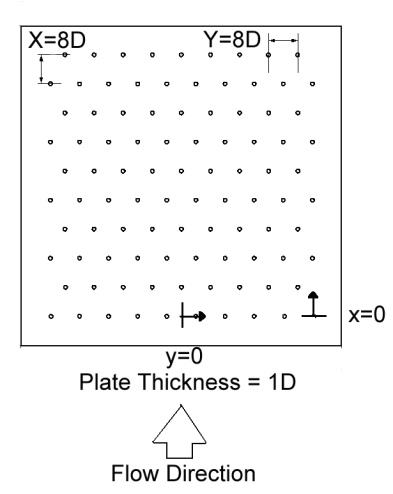
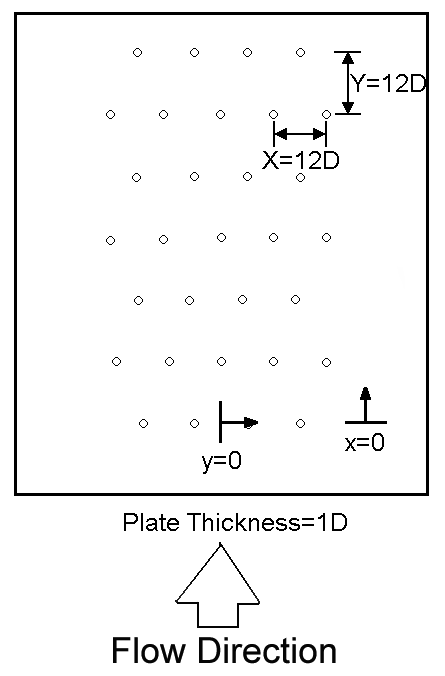
Individual plates with holes used to produce the impingement jets are located at the bottom of this plenum, as shown in Figure 2 [33-37]. The plenum is thus designed so that different impingement plates can be installed at this location using a 9.5 mm thick polyurethane gasket and ¼ in SAE J429 Grade 5 bolts. Figure 3 shows the test plate configurations which are employed [37]. Here, each impingement plate is arranged with multiple rows of holes in the streamwise direction, arranged so that holes in adjacent rows are staggered with respect to each other. With this arrangement, multiple holes are located in each streamwise row. The spacing between holes in the streamwise direction X is then either 5D, 8D, or 12D, and the spanwise spacing between holes in a given streamwise row Y is also either 5D, 8D, or 12D. The thickness of each impingement plate is 1D. The spacing between the hole exit planes and the target plate is denoted Z and is equal to 3D. Note that the coordinate systems employed are also shown in Fig. 3. The impingement cooling flow which issues from these holes is contained within the channel formed by the impingement jet plate and the target surface, as shown in Fig. 2, and is constrained to exit in a single direction, which here, is denoted as the x-direction. This channel is called the lower plenum. As different plates are employed with different sized impingement holes, this is accomplished using different polycarbonate spacers which are exactly 3D in height, and are sealed in place around three sides of the impingement channel. Plates with different impingement hole diameters are used to provide data at a variety of Mach numbers and Reynolds numbers. In all cases, all impingement passage dimensions are scaled relative to impingement hole diameter. Specific hole sizes, mass flow rates, and pressure levels are employed so that data are obtained at different Mach numbers as the Reynolds number is constant, and at different Reynolds numbers as the Mach number is constant [33-37].
When temperature ratio effects are considered, the facility arrangement shown in Fig. 1b is employed. In order to obtain different Twa/Tj temperature ratio values, the impingement air is circulated in a closed loop, and cooled to temperatures as low as -80 ºC using liquid nitrogen in two different Bonneville heat exchangers located two different plenums. In order to avoid formation of frost from water vapor initially contained in the air which passes and circulates in the facility, it is first cooled to a temperature of approximately 0 ºC for a period of at least one hour. This results in condensation of portions of the water vapor which is initially contained within the air stream. As the facility is cooled to even lower temperatures, this water is then frozen at locations which do not inhibit the passage of the impingement air throughout vital internal components of the facility. The frozen water is collected into trap areas, deliberately designed for this purpose. This approach serves to dry the air somewhat before air temperatures below 0 ºC are utilized [36].
2.4 Local Nusselt number measurement.
The power to the thermofoil heater, mounted on the target plate, is controlled and regulated using a variac power supply. Energy balances, and analysis to determine temperature values on the two surfaces of the target plate, then allow determination of the magnitude of the total convective power (due to impingement cooling) for a particular test. To determine the surface heat flux (used to calculate heat transfer coefficients and local Nusselt numbers), the total convective power level, provided by the particular thermofoil heater employed, is divided by the single surface area of this heater, denoted Aht. The target plate is mounted to allow for thermal expansion as it is maintained completely flat. Each target plate employed is comprised of a 0.0003 m thick etched foil heater (encased within capton), and a 0.00131 m thick polystyrene plate.
Spatially-resolved temperature distributions along the target test surface are determined using infrared imaging in conjunction with thermocouples, energy balances, digital image processing, and in situ calibration procedures. These are then used to determine spatially-resolved surface Nusselt numbers. To accomplish this, the infrared radiation emitted by the heated interior surface of the channel is captured using a Thermacam PM390 Infrared Imaging Camera, which operates at infrared wavelengths from 3.4 μm to 5.0 μm. Temperatures, measured using the calibrated, copper-constantan thermocouples distributed along the test surface adjacent to the flow, are used to perform the in situ calibrations simultaneously as the radiation contours from surface temperature variations are recorded.
This is accomplished as the camera views the test surface from behind, as shown in Fig. 2. In general, at least six thermocouple junction locations are present in the infrared field viewed by the camera. The exact spatial locations and pixel locations of these thermocouple junctions and the coordinates of the field of view are known from calibration maps obtained prior to measurements. During this procedure, the camera is focused, and rigidly mounted and oriented relative to the test surface in the same way as when radiation contours are recorded. Voltages from the thermocouples are acquired using apparatus which is described elsewhere [33-37]. With these data, gray scale values at pixel locations within images from the infrared imaging camera are readily converted to local Nusselt number values. Because such calibration data depend strongly on camera adjustment, the same brightness, contrast, and aperture camera settings are used to obtain the experimental data. The in situ calibration approach rigorously and accurately accounts for these variations.
Images from the infrared camera are recorded as 8-bit gray scale directly into the memory of a Dell Dimension XPS T800r PC computer using a Scion Image Corporation Frame grabber video card, and Scion image v.1.9.2 software. One set of 15 to 20 frames is recorded at a rate of about one frame per second. All of the resulting images are then ensemble averaged to obtain the final gray scale data image. This final data set is then imported into Matlab version 6.1.0.450 (Release 12.1) software to convert each of 256 possible gray scale values to local Nusselt number at each pixel location using calibration data. Each individual image covers a 256 pixel by 256 pixel area [33-37].
3 Experimental Results and Discussion
The results which follow are presented in four parts. First, crossflow mass velocity-to-jet mass velocity ratio data and discharge coefficient data are presented for three different impingement jet hole spacing arrangements. Second, experimental measurements which illustrate the separate effects of Reynolds number and Mach number on impingement array heat transfer are given, including spatially-resolve measurements of Nusselt numbers, as well as surface recovery factors. Third, results which illustrate the influences of temperature ratio are presented and discussed. Finally, in the fourth part, effects of spacing of the holes within an impingement array are considered and discussed.
3.1 Crossflow mass velocity-to-jet mass velocity ratio and discharge coefficients.
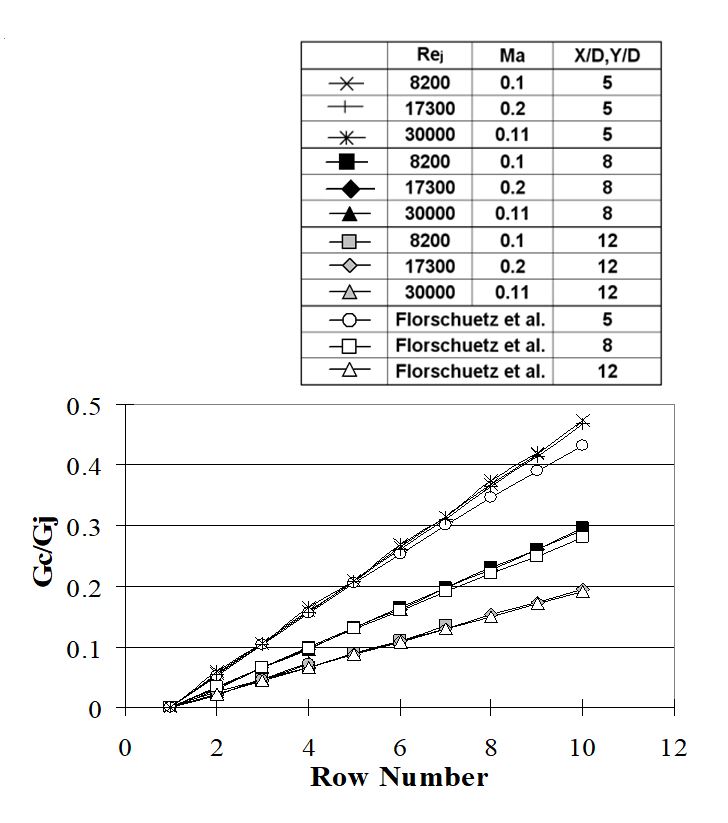
Figure 4a shows several examples of the ratio of crossflow mass velocity-to-jet mass velocity as it varies with hole row number for hole spacings of 5D, 8D and 12D. This ratio is only as high as about 0.48 at the end of all rows of holes when X/D and Y/D are both equal to 5.0. Here, data from the present study show reasonably good agreement with the correlation of Florschuetz et al. [9]. Note that, Gc/Gj values are lower for 12D hole spacing than for 8D hole spacing, with 5D having the highest values when compared at a particular value of x/D [37].
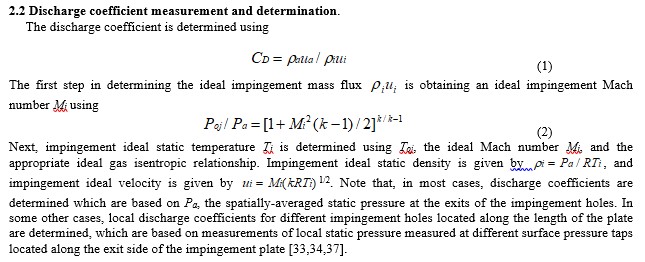
Discharge coefficients represent average values for all of the impingement holes on a particular test plate, and are presented in Figure 4b. Here, all discharge coefficients are based upon Pa, which is the ambient pressure measured at the exit of the impingement flow facility. From Fig. 4b, it is apparent that discharge coefficients decrease slightly as the Reynolds number increases, provided the Mach number is 0.2, and the spacings of holes within the impingement array are maintained constant [37].
3.2 Separate effects of Reynolds number and Mach number on impingement array heat transfer.
The discussion which follows includes consideration of different methods to determine the local Nusselt number, including consideration of local variations of recovery factor and local variations of surface adiabatic temperature.
3.2.1 Determination of spatially-averaged adiabatic surface temperature, Toj*. To determine an appropriate reference temperature for the determination of heat transfer coefficients and Nusselt numbers, the convective heat power from the impingement side of the target plate qcf is determined as it varies with (Tw–Toj) [33,34]. Data are obtained at three different temperature differences. The largest temperature difference employed is always less than 30ºC to avoid variations of measured Nusselt numbers with variable property effects. Such convective heat power data then vary linearly with (Tw–Toj). Such linear data are extrapolated to the qcf=0 axis to determine (Tw–Toj*). Note that the convective power is the value for the entire target plate. Consequently, the magnitude of Toj* is spatially-averaged over the target plate heat transfer area, and as such, is the spatially-averaged adiabatic surface temperature for the entire heated portion of the target plate at a particular experimental condition. Consequently, all Nusselt number data are obtained at three different values of (Tw–Toj) to provide a means to determine the magnitude of Toj* for each experimental condition. All Nusselt numbers are then determined using
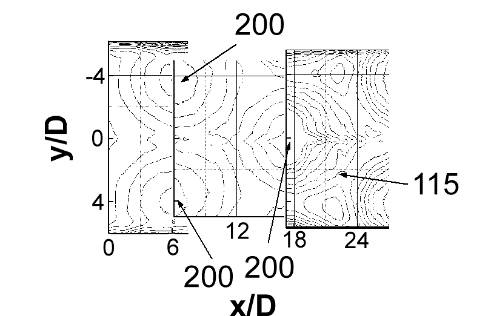
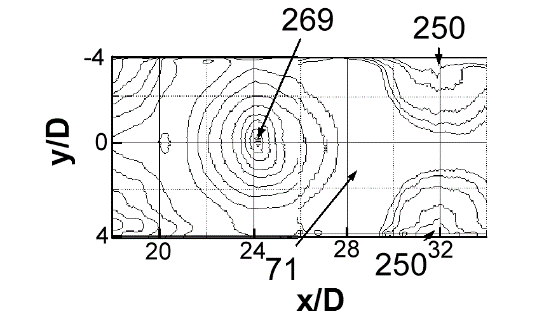
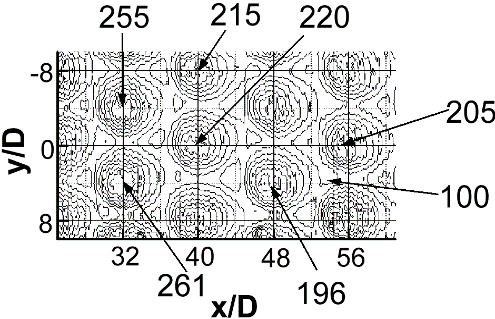
3.2.2 Nusselt number variations with Mach number and Reynolds number. Local spatially-resolved surface Nusselt number distributions for Rej=60,000 and Ma values from 0.16 to 0.74 are given in Figs. 5a-e. The different views of the test surface in the different parts of this figure are due to different infrared camera views of the target plate as impingement plates with different sized holes are employed on the opposite side. Note that, regardless of the Mach number, the qualitative distributions of local Nusselt number produced by each impingement jet are similar, with good periodic repeatability in the spanwise direction for each streamwise row of impact locations. This includes local distributions associated with each impingement impact area at different spanwise locations in each streamwise row [34].
Figures 5a-e also show that only one local maximum value is present in the Nu distribution underneath each jet. In general, magnitudes of these local jet maxima underneath the different impingement jets decrease as the flow develops in the streamwise direction and x/D increases, for particular Ma and Rej values. This trend is also illustrated by local Nusselt number data presented as they vary with x/D for each y/D location. Another important conclusion, apparent from the results given in Figs. 5a-e, is that local maximum Nu values generally increase somewhat at each x/D and y/D surface location, as Mach number increases, provided the Reynolds number is held constant. A similar conclusion is also reached as the Reynolds number increases, provided the Mach number is held constant [34].
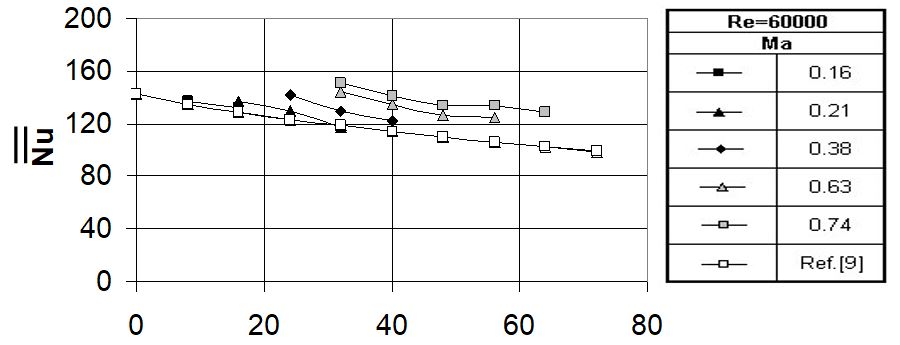
Corresponding line-averaged Nusselt number data as they vary with x/D are given in Fig. 6, also for Rej=60,000 and Ma=0.16, 0.21, 0.38, 0.63, and 0.74. These data are also obtained by line-averaging over y/D values from -8.0 to +8.0. Here, streamwise variations of line-averaged Nusselt numbers are evident. Figure 6 shows that local maximum line-averaged Nusselt number values have the same approximate streamwise spacing as the streamwise spacing of the holes located on the impingement jet plate. Associated local maximum values here generally decrease at successive x/D locations for each value of impingement Mach number, Ma. In most cases, line-averaged Nusselt number values increase at each x/D location as Ma increases. Exceptions to this trend are exhibited by the Ma=0.21 data which show higher peak values (compared to data measured at lower Mach numbers) near the x/D=16, x/D=24, and x/D=32 locations [33,34].
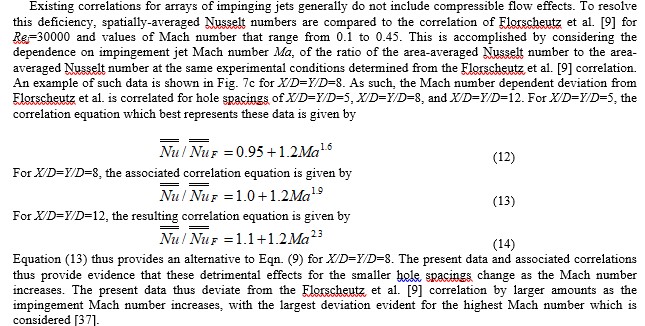
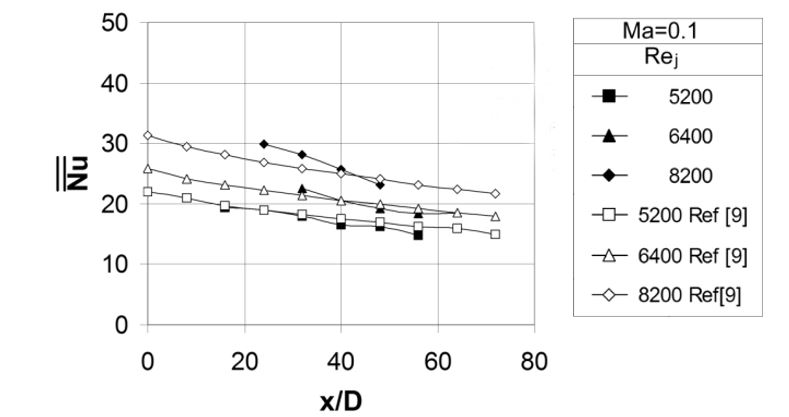
3.2.3 Comparisons of spatially-averaged Nusselt numbers with existing correlations, and a new correlation to account for Mach number effects. Spatially-averaged Nusselt numbers are compared to the correlation of Florschuetz et al. [9] in Figs. 7a and 7b. Each data point in these figures from the present investigation is determined by averaging local Nusselt number data over y/D values from -8.0 to +8.0, and over an x/D range of 8.0 (or x/D=-4.0 to x/D=+4.0) relative to the centers of the nominal jet impact locations (which correspond to the x/D centers of the impingement plate holes). The first of these figures shows Ma=0.10 data for Rej values of 5200, 6400, and 8200. Here, data from the present study show reasonably good matches to the correlation values from Florschuetz et al. [9] for all of these experimental conditions. Fig. 7b presents the present spatially-averaged data for Rej=60,000, and Ma values of 0.16, 0.21, 0.38, 0.63, and 0.74. In this figure, the experimental data associated with Ma=0.16 and Ma=0.21 are in good agreement with values from the Florschuetz et al. [9] correlation. The present data then deviate from this correlation by larger amounts as the impingement Mach number increases further, with the largest deviation evident for Ma=0.74. In general, the trends shown by the data in Fig. 7b are qualitatively consistent with results from Brevet et al. [22] for a single impingement jet.
The variation of spatially-averaged Nusselt numbers with Mach number is shown in Fig. 7c. These data are given for specific x/D values, and for specific values of the impingement Mach number. The correlation equation which best represents these data is given by
![]()
As such, this correlation equation is valid for Rej=60000, 0.21≤Ma≤0.74, X/D=8, Y/D=8, Z/D=3, and 20≤x/D≤60 [34]. Equation (9) thus provides a means to determine Nusselt number data for compressible flows at elevated Mach numbers, relative to values from the Florschuetz et al. [9] correlation.
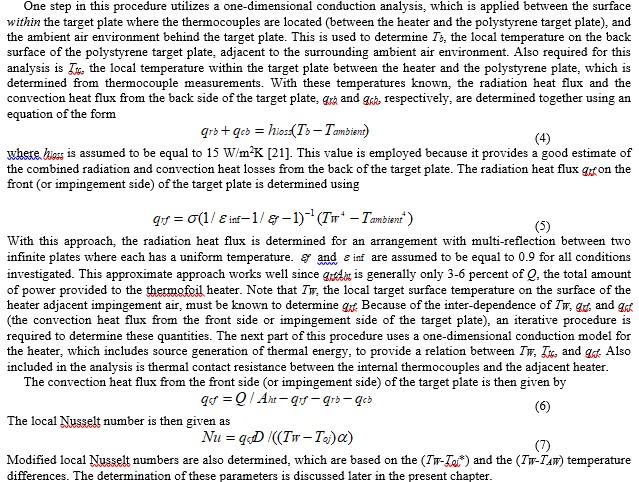
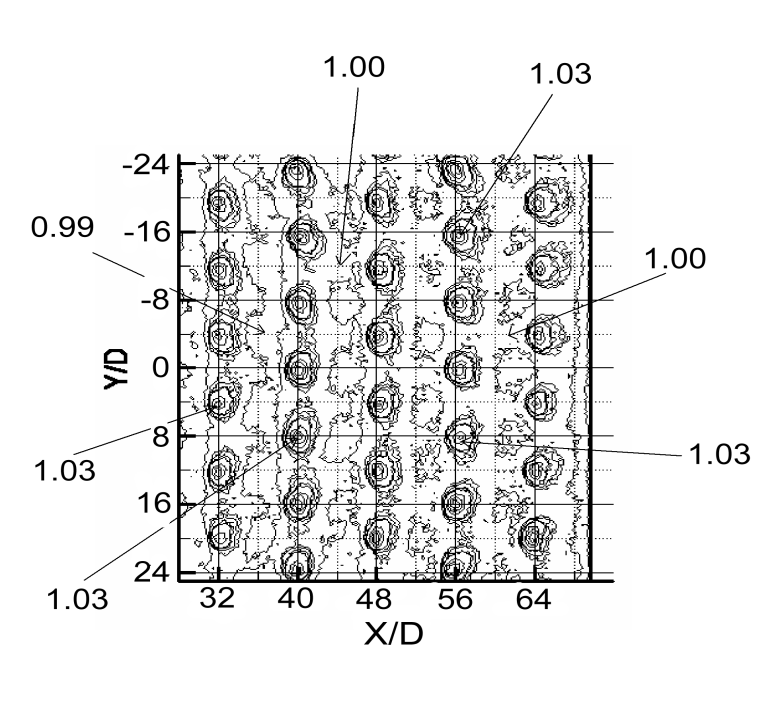
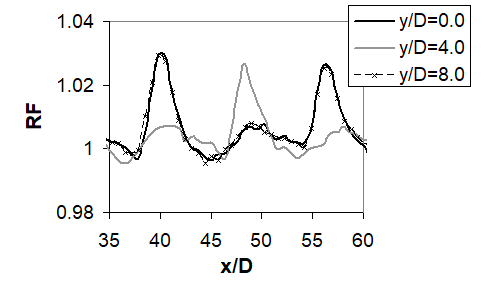
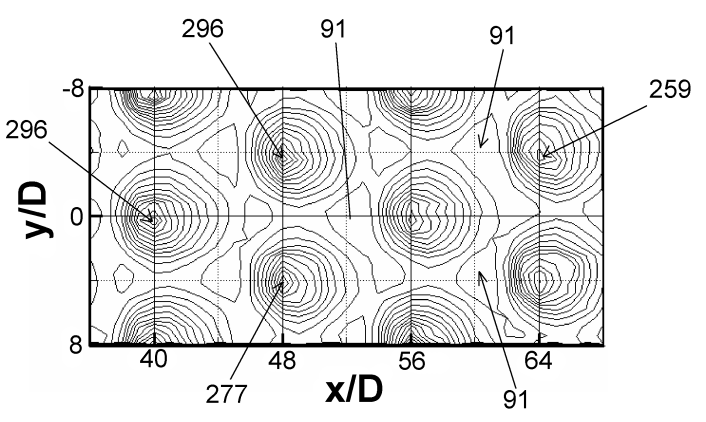
3.2.4 Recovery factor data. Recovery factor data provide information on the variation of adiabatic surface temperature over the test surface. Recovery factor data are important because they provide a means to account for local variations of adiabatic surface temperature TAW. Local RF values are occasionally greater than 1.0 because the dynamic temperature (Toj –Tj) within the denominator of Eqn. (3) is based upon overall, average impingement jet kinetic energy. Examples are shown in Figs. 8a-c for Rej=60,000 and Ma=0.74. The contour plot data in Fig. 8a show higher values of recovery factor RF beneath and in the vicinity of impact locations of the impingement jets. This is because Toj=23.27 C, which is approximately equal to Tambient for these tests, which gives Tj equal to -6.16 C. As a result, there is heat transfer to the impinging air streams from the surrounding air, an effect which is enhanced by the families of vortices associated with the jet, and the enhanced mixing and entrainment they produce of surrounding fluid to the jets [12]. Nearby jet impact locations, values of RF continue to be relatively high and in general, greater than 1.0, especially on the spanwise sides of impact locations. However, values are occasionally less than one at upstream and downstream locations. Such local variations and the quantitative variations associated with them are further illustrated by the local RF data presented as it varies with x/D for y/D=0, 4, and 8 in Fig. 8b, and as RF varies with y/D for x/D=32, 48, and 56 in Fig. 8c. Note that values of TAW, determined from RF data and spatially-averaged over the test surface, approximately match magnitudes of Toj* for most all experimental conditions where these data are measured [34].
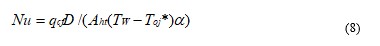
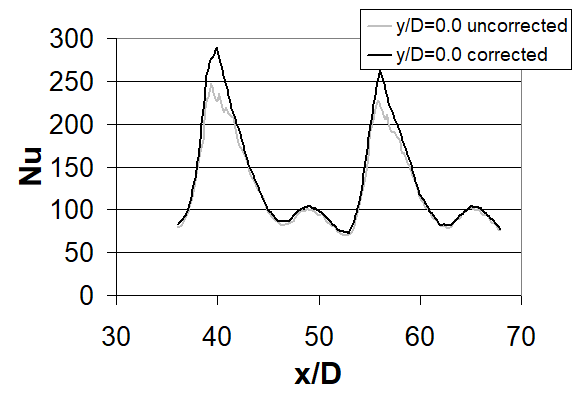
3.2.5 Nusselt number data corrected using local recovery factors. The local and line-averaged Nusselt number data presented in Figs. 9a, 9b, and 9c are based on the difference between the local, spatially-varying measured surface temperature TW, and the local adiabatic surface temperature TAW, determined from recovery factor data given in Fig. 8a. This is accomplished by correcting local Nusselt number values using the equation given by

Recall that Toj* represents the adiabatic surface temperature, spatially-averaged over the test plate. The results in Figs. 9a, 9b, and 9c are given for Rej=60,000 and Ma=0.74. A comparison of Fig. 9a with results presented in Fig. 5e then shows that local corrected Nusselt numbers Nuc based on local (TW–TAW) (i.e. Fig. 9a) have slightly higher peaks than local Nu values based on (TW–Toj*) (Fig. 5e). This trend is also illustrated by the local Nusselt number data presented as it varies with x/D (for y/D=0) in Fig. 9b, as well as by the line-averaged Nusselt number data given in Fig. 9c. The relative differences between corrected and uncorrected data in these figures are generally quite small because recovery factors in Figs. 8a, 8b, and 8c are close to 1.00 with the largest values in the vicinity of 1.03. As a result, spatially-averaged Nusselt numbers are approximately the same regardless of whether they are based upon (TW–TAW) or (TW–Toj*). Note that local recovery factor RF values are sometimes greater than 1.0 because a spatially-averaged value of Toj (for all of the impingement array holes) is used determine local RF magnitudes at all test surface locations [34].
3.3 Effects of temperature ratio on impingement array heat transfer.
Figures 10-12 show the effects of Twa/Tj temperature ratio on local and spatially-averaged Nusselt number data for Rej=18,000 and Ma=0.2. These data at different increasing values of Twa/Tj are obtained by decreasing the impingement jet static temperature Tj and increasing Twa, where Twa is the spatially-averaged target wall temperature, and Tj is the impingement jet static temperature.
3.3.1 Local surface Nusselt number variations with temperature ratio. Surface Nusselt number distributions are presented in Figs. 10a-f for Ma=0.20, Rej=18,000, and Twa/Tj = 1.06, 1.25, 1.36, 1.48, 1.58, and 1.73. Note that, regardless of the temperature ratio, the qualitative distributions of local Nusselt number produced by each impingement jet are similar, with good periodic repeatability in the spanwise direction for each streamwise row of impact locations. Figures 10a-f also show that each impingement jet produces only one local maximum value in the Nu distribution on the target surface beneath each jet. Magnitudes of these local maximum values decrease underneath the different impingement jets with Twa/Tj, for the Twa/Tj values investigated, with minor variations between streamwise rows as x/D increases. Variations with streamwise distance are due to the increasing effect of hot, spent air crossflow, which reduces the effectiveness of the impinging jets. Figures 10a-f also show that local Nu values decrease as the temperature ratio increases, with the most noticeable differences evident in peak (or local maximum) values. This is partially because, as temperature ratio increases at constant Reynolds number, the intensity of the impingement jets decreases due to the decreases in both mass flow rate and volumetric flow rate [36].
3.3.2 Spatially-averaged Nusselt number variations with temperature ratio. Spatially-averaged Nusselt numbers are averaged over an area that extends ±4 diameters from the specified x/D location and over y/D data points from -8 to 8. This area thus amounts to two complete spatial periods of impingement jet array geometry. Note that spatially-averaged target surface temperatures Twa are determined over the same spatial surface areas.
Figure 11 gives spatially-averaged Nusselt numbers at different values of Twa/Tj, along with values from the correlation of Florscheutz et al. [9]. There are noticeable differences between the present data for Twa/Tj=1.06 and the correlation of Florscheutz et al. [9], which is for a temperature ratio Twa/Tj of approximately 1.1. This is because the experimental conditions for the present data are outside the range of validity of the Florscheutz correlation. In both cases, spatially-averaged Nusselt number data points are given for x/D of 32, 40, 48, and 56. For each of these streamwise locations, the results in Fig. 11 show that area-averaged Nusselt numbers decrease as the Twa/Tj temperature ratio increases up to 1.73, provided the impingement jet static temperature is held constant. Such behavior evidences some deterioration of impingement cooling performance. This is because the variable property effects degrade local turbulent transport. In addition, the high crossflow temperature relative to jet temperature decreases the effectiveness of the impinging jets, and causes area-averaged Nusselt numbers to decrease with x/D at each Twa/Tj temperature ratio value [36].
3.3.3 Spatially-averaged Nusselt numbers and the temperature ratio correlation equation. Figure 12 shows Nusselt number ratios Nu/Nucp as they depend upon temperature ratio Twa/Tj for Rej=18000 and Ma=0.2. Nucp represents the constant property Nusselt number, a condition corresponding with a temperature ratio, Twa/Tj, of approximately one. In the present study a temperature ratio near one (1.06) is used as an approximation for Nucp. The Nu/Nucp data in Fig. 12 follow the same trend as Fig. 11, which shows a decrease in Nusselt number as the Twa/Tj temperature ratio increases from 1.06 to 1.73. The correlation equation which best represents the data in Fig. 12 is given by [36]
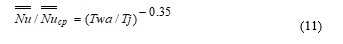
This correlation equation is determined for Rej=18000, Ma=0.2, 1.060≤Twa/Tj≤1.73, X/D=8, Y/D=8, Z/D=3, and 32≤x/D≤56. However, Eqn. (11) is expected to be valid for a wider range of incompressible (or near incompressible) flow conditions, which include Rej from near 3,000 to about 30,000, Ma from near 0 to approximately 0.25, and a range of X/D and Y/D values in the vicinity of 8.
The Nusselt number variations which are observed as either Twa/Tj or Tw/Tj varies are mostly due to variable property effects. Most important are variations of molecular thermal conductivity, absolute viscosity, and static density with spatial location and time, since these change as static temperature varies with spatial location and time. Note that the contributions of specific heat to Nusselt number variations are less important because its weak dependence on temperature in gas flows. The effects of conductivity, viscosity, and density variations on local turbulent transport of momentum and heat are complex. For example, turbulent transport is generally mostly a result of mixing, collisions, and interactions of different sizes of turbulent eddies. However, ultimately, as molecular scales are approached, thermal transport is due to conduction between adjacent packets of oscillating fluid. In many cases, such molecular conduction provides some restriction on overall magnitudes of turbulent transport which can be achieved. Such limitations and the associated phenomena and interactions are especially complex in impingement array flows because they involve such a wide variety of phenomena, including jet flows, shear layer interactions, stagnation regions, interactions between adjacent impingement jets, wall-jet interactions, three-dimensional boundary layer development, and interactions between impingement jets and these boundary layers [36].
3.4 Effects of hole spacing on impingement array heat transfer.
The results presented in Figs. 13-16 illustrate the influences of hole spacing on impingement array surface heat transfer, for different Reynolds numbers and different Mach numbers.
3.4.1 Line-averaged Nusselt numbers. Figures 13a-c present Nusselt numbers which are line-averaged over y/D from –2.5 to +2.5 for a hole spacing of 5D, over -4.0 to +4.0 for a hole spacing of 8D, and over -6.0 to +6.0 for a hole spacing of 12D. Figures 13a-c show line-averaged Nusselt number comparisons as the Mach number varies at constant Reynolds number for each of the three hole spacings. Here, comparisons at constant x/D and constant Reynolds number generally show increases of line-averaged Nusselt numbers with Mach number. Line-averaged Nusselt number comparisons as the Reynolds number changes at constant Mach number for each of the three hole spacings show considerable increases with Reynolds number, as well as values which decrease in a periodic fashion with streamwise development as x/D increases. This decrease with x/D is more pronounced for smaller hole spacings due to increased effects of spent air crossflow [37].
3.4.2 Spatially-averaged Nusselt numbers. Figures 14-16 compare measured spatially-averaged Nusselt numbers for hole spacings of 5D, 8D, and 12D with correlation values from Florschuetz et al. [9]. These data are obtained by averaging over areas in the streamwise and spanwise directions, which are the same as the spanwise averaging distance used to obtain the line-averaged data.
Figure 14a shows comparisons for 5D hole spacing at a constant Mach number of 0.17 and Rej values of 17300, 30000, and 59000. Here, measured and correlation-predicted values [9] are in agreement within 5 to 10 percent for the lower Rej values. Figure 14b shows the comparison for 5D hole spacing at constant Reynolds number and Mach number values of 0.09, 0.17, 0.30, and 0.38. Here, the two data sets for Ma ≤ 0.2 show good agreement with Florschuetz et al. [9], with a departure from the correlation that increases with increasing Mach number at each x/D value.
Figure 15a shows the comparison for 8D hole spacing at constant Mach number of 0.20 and Rej values of 11100, 13100, 17300, 30500, and 59000. In all cases, there is good agreement between measured and correlation-predicted values [9]. Figure 15b shows the comparison for 8D hole spacing at constant Reynolds number, and Mach number values of 0.10, 0.20, 0.35, 0.45, and 0.59. Here, as seen for the 5D hole spacing data, the two cases for Ma ≤ 0.2 show good agreement with Florschuetz et al. [9], with a departure from the correlation that increases with increasing Mach number at each x/D value [37].
Figure 16a shows that, at constant Mach number, data for hole spacing 12D show good agreement with the correlation predicted values [9] for Rej=17300. When Rej=30000 and Rej=57000, measured values are then higher than predicted values. Figure 16b shows that for near-incompressible cases, when Ma=0.11 and Ma=0.22, spatially-averaged Nusselt number values are in agreement with each other, but higher than Florschuetz et al. [9] predicted values. These differences are not surprising when one considers that the 12D hole spacing data are outside the range of applicability of the Florschuetz et al. [9] correlation, which does not consider geometries with hole spacing greater than 8D for a staggered array. Area-averaged Nusselt numbers then increase with Mach number at each x/D value, which is consistent with results presented in Figs. 14b and 15b for the two smaller hole spacings [37].
3.4.3 Correlations to account for compressibility on spatially-averaged Nusselt numbers with different hole spacings. Variations due to different impingement jet spacings are, in part, because each jet produced using the larger spacing of X/D=Y/D=12 approximates the behavior of an individual jet. When X/D=Y/D=8 and X/D=Y/D=5, the cumulative effects of induced cross-flows partially reduce the effectiveness of each individual jet. However, because the jets are closer together, with greater local influences of surrounding jets, line-averaged and area-averaged Nusselt numbers are generally higher as X/D and Y/D decrease [37].
Of importance to such changes are the vortices which form around the impinging jets, and then interact with each other after they impact on the target surface [12]. Interactions of these jet vortices with the accumulation of cross-flows from sequential rows of jets, which are especially apparent in associated data for the 5D and 8D jet spacings, are also important, and generally give general trends of decreasing local and spatially-averaged Nusselt numbers with x/D. These interactions are tied to the unsteady vortex structures and vortex rings which initially form around the periphery parts of the impingement jets. According to Fox et el. [12], it is the competition between these vortex rings and the associated secondary vortices induced by them which determine the local stagnation temperature and static temperature distributions on the impingement target plate. The resulting total temperature alterations from these vortices are then also responsible for enhancing the surface heat transfer and the surface Nusselt number distributions. Depending upon the interactions between the primary and secondary vortex rings after they impact and advect along the target plate, different amounts and distributions of surface heating and/or cooling can be produced [12].
Compressibility, even in a mild form, alters these complex vortex interactions. Complications and complexity also result as the compressible vortex rings and the associated secondary vortices from different impingement jets intermingle and interact with each other in a myriad of possible forms and combinations. The results of these interactions are evident in the data presented in Figs. 5-16, which show that the associated changes are generally most apparent in local values (i.e. with smaller periodic variation with x/D or y/D), than values which are line-averaged or area-averaged [37].
3.5 Effects of jet-to-target-plate distance on impingement array heat transfer.
The results in Figs. 17 and 18 illustrate the influences of jet-to-target plate distance on impingement array heat transfer.
3.5.1 Spatially-resolved local Nusselt numbers. Figure 17 presents local Nusselt number comparisons for normalized jet-to-target plate distances Z/D of 1.5, 3.0. 5.0, and 8.0, as dependent upon y/D for particular values of x/D, and as dependent upon x/D for particular values of y/D. These data are presented for an impingement Reynolds number of approximately 8,200. For all conditions examined, lower local values are generally present both at and between jet impact locations as Z/D approaches 8.0, when compared at the same Rej, x/D, and y/D. The highest local maximum Nusselt numbers appear to be associated either with Z/D of 3.0 or 5.0. Associated overall local Nusselt number decreases with increasing Z/D (at most all x/D and y/D values) are due to diminished jet coherence, as well as diminished coherence of associated Kelvin-Helmholtz generated vortices, which occur as jet advection distances become larger. However, regardless of the value of Z/D, magnitudes of successive local peak Nusselt numbers, at successive jet stagnation point impact locations, generally decrease with x/D for all values of Z/D and impingement Reynolds number which are considered.
When examined at a particular value of Rej, note that the streamwise locations of local maximum Nusselt numbers shift to larger x/D locations as the normalized jet-to-target distance increases. This is a result of larger advection distances between the impingement hole exits and the target plate, which allow crossflows to exert greater influences in shifting the locations of jet impact stagnation points. The Kelvin-Helmholtz generated vortices, which form in an intermittent fashion around each jet, also play a role in this process, especially as they periodically impact onto the target surface and are then advected in the crossflow direction. Such unsteady vortices are also important in augmenting local Nusselt number values at target surface locations in the near-vicinity of stagnation point locations [42].
3.5.2 Spatially-averaged Nusselt numbers. Spatially-averaged Nusselt numbers for a jet hole spacing of X/D=Y/D=8 are presented in Fig. 18. Each spatially-averaged value is determined over an area which extends over an x/D range from -4.0 to +4.0 relative to each streamwise row location, and over a y/D range comprised of one or two complete periods of local spanwise Nusselt number variation. The spatially-averaged Nusselt number results in Fig. 18 are given to illustrate the dependence upon Z/D for an Rej value of 8200. Important variations with normalized jet-to-target plate distance are apparent. Note that the highest spatially-averaged Nusselt numbers are present for Z/D=3.0 and for Z/D=5.0 for Rej=8,200.
Such changes of local and spatially-averaged Nusselt numbers with Z/D, and the resulting optimal values, are believed to be a result of the competing influences of two different phenomena: (i) the coherence of individual jets and the strength of adjacent shear layers, and (ii) the development and advection of vortices generated by Kelvin-Helmholtz instabilities. The coherence of individual jets and the intensity of the adjacent shear layers, are strongest just after each jet emerges from an impingement plate hole. With this situation, maximum local jet velocities are distributed over the central part of each jet, with the largest gradients of velocity present in the thinnest shear layers which surround each jet. As each jet advects downstream and surrounding fluid is entrained to become part of each jet, the local velocity profile becomes more rounded with adjacent hear layer velocity gradients which are less intense as jet fluid diffuses and advects in lateral directions. If such jets impinge upon a surface, the highest local and spatially-averaged surface Nusselt number augmentations are expected to be present just after jets emerge from originating holes, when they are most coherent with the most intense adjacent shear layers.
Another mechanism for local heat transfer augmentation is formation, development, and surface impact of Kelvin-Helmholtz generated vortices. In contrast to the diminishing jet coherence with streamwise development, these vortices continue to develop as they advect in the streamwise direction. Their ability to augment thermal transport is a result of the mixing they induce between the jet and surrounding non-jet fluid. The resulting gradients of density (if the flows are compressible) and stagnation temperature within the vortices are key elements in their capability to augmention local heat transfer coefficients and Nusselt numbers [42].
The relative influences of the jet/shear layer coherence and Kelvin-Helmholtz generated vortices are reflected in the Z/D values associated with the highest Nusselt numbers. For higher jet Reynolds numbers Rej, jet/shear layer coherence seems to be more important, since Z/D=1.5 gives optimal surface Nusselt numbers for an impingement array. For lower Reynolds numbers, the Kelvin-Helmholtz vortices have greater influences since Z/D from 3.0 to 5.0 give optimal impingement Nusselt numbers [42].
4 Summary and Conclusions
Experimental data, obtained from multiple investigations conducted since 2003, illustrate a variety of influences on impingement array heat transfer, including: (i) the separate effects of Reynolds number and Mach number, (ii) the influences of temperature ratio, and (iii) the effects of spacing of the holes within an impingement array. As such, data are given for spacings between holes in the streamwise direction X and the spanwise direction Y of 5D, 8D, and 12D. The thickness of each impingement plate is 1D, and the spacing between the hole exit planes and the target plate is denoted Z and is equal to 3D.
Experimental spatially-averaged, surface Nusselt number data obtained for a constant impingement Mach number Ma of 0.1, and different Reynolds numbers Rej from 5200 to 8200 show good agreement with the correlation of Florschuetz et al. [9]. Nusselt number data obtained at a constant Reynolds number of 60000 and different impingement Mach numbers also shows good agreement with the Florschuetz et al. [9] correlation, provided Ma=0.16 and Ma=0.21. Measured spatially-averaged results for Rej=60000 then deviate from this correlation by larger amounts as the impingement Mach number increases further, with the largest deviation evident for Ma=0.74. A new correlation equation for spatially-averaged Nusselt numbers is then presented for this range of Mach numbers. The variations represented by this correlation are due to local Nusselt numbers, which generally increase with Mach number at different x/D and y/D locations, provided Rej=60000 and impingement Mach number Ma is greater than 0.21. Local, spatially-resolved Nusselt number data also show that only one local maximum value is present underneath each jet, with local peak line-averaged Nusselt number values, which generally decrease with streamwise development at successive x/D locations.
Local spatially-resolved Nusselt number data obtained a Mach number Ma of 0.74, and Rej=60000 are also corrected to account for local variations of the adiabatic surface temperature, which are determined from local recovery factor data. Local corrected Nusselt numbers, based on local (TW–TAW), then have higher peaks than local Nusselt numbers which are based upon (TW–Toj*). This is because local recovery factor RF data are higher beneath and in the vicinity of impact locations of the impingement jets, with values as large as 1.03. Note that the compressible data obtained at these experimental conditions are most applicable for impingement cooling of industrial engine combustor liners.
Data are also provided to illustrate the effects of the ratio of impingement target plate temperature to impingement jet temperature, at constant Reynolds number. The spacing between holes in the streamwise direction X is then 8D, and the spanwise spacing between holes in a given streamwise row Y is also 8D. The thickness of each impingement plate is 1D, and the spacing between the hole exit planes and the target plate is denoted Z and is equal to 3D.
Local and spatially-averaged Nusselt numbers decrease as the Twa/Tj temperature ratio increases for any particular x/D and y/D location for Rej=18,000 and Ma=0.2. The spatially-averaged Nusselt number decrease is especially substantial as the Twa/Tj temperature ratio increases from 1.06 to 1.73, which evidences some deterioration of impingement cooling performance. The area beneath each impingement jet shows a higher rate of heat transfer than the surrounding areas which do not have the additional heat transfer benefit associated with perpendicular impinging jets. The effect of increasing temperature ratio is more apparent in the regions under the impinging jets where the heat transfer is noticeably reduced, a contrast from the surrounding areas, which show almost no change. This is believed to be due to variable property effects which degrade local turbulent transport in the impingement flow as Twa/Tj increases.
New experimental data are additionally provided when flows are compressible, as the jet hole spacing is varied for Reynolds numbers from 17300 to 60000, and for Mach numbers as high as 0.45. The spacings between holes in the streamwise direction X are then 5D, 8D or 12D, and the spanwise spacings between holes in a given streamwise row Y are also 5D, 8D or 12D. The thickness of each impingement plate is 1D, and the spacing between the hole exit planes and the target plate is denoted Z and is equal to 3D. These data are given for an array of impinging jets in the form of ratios of crossflow mass velocity to jet mass velocity, discharge coefficients, line-averaged Nusselt numbers, and spatially-averaged Nusselt numbers.
Measured Nusselt number data for each of the three hole spacing configurations show strong dependence on Mach number, for Mach numbers greater than 0.2, as Reynolds number is held constant. The correlations developed from these experimental data show that increasing the Mach number improves heat transfer for each geometry to differing degrees, with the strongest Mach number dependence for the X/D=Y/D=12 array. When the impingement jet Mach number is less than about 0.2, local, line-averaged, and area-averaged data show strong Reynolds number dependence, but almost no dependence on Mach number for each jet spacing arrangement. Each jet produced using X/D=Y/D=12 approximates the behavior of an individual jet, whereas the influences of surrounding jets, including the cumulative induced cross-flows and interactions of jet-induced vortex structures become more pronounced when X/D=Y/D=8 and when X/D=Y/D=5. The present experimental data also show that spatially-averaged Nusselt numbers are generally higher for smaller hole spacings than for more sparse arrays when compared at the same streamwise location. In addition, the 12D jet spacing area-averaged Nusselt number data show the least variation with x/D while the 5D jet spacing shows the largest. Corresponding periodic line-averaged Nusselt number data show that values decrease significantly at successive x/D locations for X/D=Y/D=5, whereas X/D=Y/D=12 periodically-varying data are approximately invariant with x/D.
Experimental results are presented which illustrate the effects of jet-to-target plate distance on the heat transfer from an array of jets impinging on a flat plate. Considered is a Reynolds number Rej of 8,200. Non-dimensional jet-to-target plate distances Z/D are 1.5, 3.0, 5.0, and 8.0, and normalized streamwise and spanwise hole spacings, X/D and Y/D, respectively, are both 8.0. Experimental results also illustrate important variations of local, and area-averaged Nusselt numbers with normalized jet-to-target plate distance, especially for smaller values of this quantity. As such, the highest Nusselt numbers generally appear to be associated either with Z/D of 3.0 or 5.0 for Rej of 8,200. Associated overall and local Nusselt number changes with Z/D (at most all x/D and y/D values) are due to the competing influences of jet/shear layer coherence, and Kelvin-Helmholtz generated vortices. In general, the former are believed to be more influential for smaller jet advection distances, whereas the latter are likely more important as jet advection distances become larger.
5 Acknowledgements
All of the presented results were obtained under sponsorship of Solar Turbines Inc. The author gratefully acknowledges this support, as well as the opportunities to collaborate with Dr. Hee-Koo Moon and Dr. Mike Fox. Dr. Matt Goodro and Dr. Jongmyung Park played vital and important roles in obtaining the results which are presented, especially in regard to the detailed and meticulous experimental procedures which were employed to obtain results of excellent quality.

7 References
[1] Martin, H., “Heat and Mass Transfer Between Impinging Gas Jets and Solid Surfaces,” Advances in Heat Transfer, Vol. 13, pp. 1-60, 1977.
[2] Schulz, A., “Combustor Liner Cooling Technology In Scope of Reduced Pollutant Formation and Rising Thermal Efficiencies,” Annals of the New York Academy of Sciences, Heat Transfer in Gas Turbine Systems, Vol. 934, pp.135-146, 2001.
[3] Kercher, D. M., and Tabakoff, W., “Heat Transfer by a Square Array of Round Air Jets Impinging Perpendicular to a Flat Surface Including the Effect of Spent Air,” ASME Transactions-Journal of Engineering for Power, Vol. 92, pp. 73-82, 1970.
[4] Chance, J. L., “Experimental Investigation of Air Impingement Heat Transfer Under an Array of Round Jets,” TAPPI 57, Vol. 6, pp. 108-112, 1974.
[5] Metzger, D. E., Yamashita, T., and Jenkins, C., “Impingement Cooling of Concave Surfaces With Lines of Circular Air Jets,” ASME Transactions-Journal of Engineering for Power, Vol. 91, pp. 149-158, 1971.
[6] Chupp, R., Helms, H., McFadden, P., and Brown, T., “Evaluation of Internal Heat-Transfer Coefficients For Impingement Cooled Turbine Airfoils,” AIAA-Journal of Aircraft, Vol. 6, No. 3, pp. 203-208, 1969.
[7] Metzger, D. E., and Korstad, R., “Effects of Crossflow on Impingement Heat Transfer,” ASME Transactions-Journal of Engineering for Power, Vol. 94, pp. 35-41, 1972.
[8] Metzger, D. E., Florschuetz, L. W., Takeuchi, D. I., Behee, R. D., and Berry, R. A., “Heat Transfer Characteristics for Inline and Staggered Arrays of Circular Jets With Crossflow of Spent Air,” ASME Transactions-Journal of Heat Transfer, Vol. 101, pp. 526-531, 1979.
[9] Florschuetz, L. W., Truman, C. R., and Metzger, D. E., “Streamwise Flow and Heat Transfer Distributions For Jet Array Impingement With Crossflow,” ASME Transactions–Journal of Heat Transfer, Vol. 103, pp. 337-342, 1981.
[10] Obot, N. T., and Trabold, T. A., “Impingement Heat Transfer Within Arrays of Circular Jets: Part 1-Effects of Minimum, Intermediate, and Complete Crossflow For Small and Large Spacings,” ASME Transactions-Journal of Heat Transfer, Vol. 109, pp. 872-879, 1987.
[11] Bunker, R., and Metzger, D. E., “Local Heat Transfer in Internally Cooled Turbine Airfoil Leading Edge Regions: Part 1 – Impingement Cooling Without Film Extraction,” ASME Transactions-Journal of Turbomachinery, Vol. 112, pp. 451-458, 1990.
[12] Fox, M. D., Kurosaka, M., Hedges, L., and Hirano, K., “The Influence of Vortical Structures on the Thermal Fields of Jets,” Journal of Fluid Mechanics, Vol. 255, pp. 447-472, 1993.
[13] Bailey, J. C., and Bunker, R. S., “Local Heat Transfer and Flow Distributions For Impinging Jet Arrays of Dense and Sparse Extent,” 47th ASME Gas Turbine and Aeroengine Technical Congress, Exposition, and Users Symposium, Amsterdam, The Netherlands, ASME Paper GT-2002-30473, 2002.
[14] Taslim, M. E., Pan, Y., and Bakhtari, K., “Experimental Racetrack Shaped Jet Impingement On a Roughened Leading-Edge Wall With Film Holes,” 47th ASME Gas Turbine and Aeroengine Technical Congress, Exposition, and Users Symposium, Amsterdam, The Netherlands, ASME Paper GT-2002-30477, 2002.
[15] Li, X., Gaddis, J. L., and Wang, T., “Mist/Stream Heat Transfer With Jet Impingement Onto a Concave Surface,” 47th ASME Gas Turbine and Aeroengine Technical Congress, Exposition, and Users Symposium, Amsterdam, The Netherlands, ASME Paper GT-2002-30475, 2002.
[16] Parsons, J. A., Han, J. C., and Lee, C. P., “Rotation Effect on Jet-Impingement Heat Transfer in Smooth Rectangular Channels With Four Heated Walls and Radial Crossflow,” ASME Transactions-Journal of Turbomachinery, Vol. 120, pp. 79-85, 1996.
[17] Parsons, J. A., Han, J. C., and Lee, C. P., “Rotation Effect on Jet-Impingement Heat Transfer in Smooth Rectangular Channels With Four Heated Walls and Coolant Extraction,” 48th ASME Gas Turbine and Aeroengine Technical Congress, Exposition, and Users Symposium, Atlanta, Georgia, ASME Paper Number GT-2003-38905, 2003.
[18] Parsons, J. A., and Han, J. C., “Rotation Effect on Jet Impingement Heat Transfer in Smooth Rectangular Channels With Coolant Extraction,” International Journal of Rotating Machinery, Vol. 7, pp. 87-103, 2001.
[19] Epstein, A. H., Kerrebrock, J. L., Koo, J. J., and Preiser, U. Z., “Rotational Effects on Impingement Cooling,” Symposium on Transport Phenomena in Rotating Machinery, Honolulu, Hawaii, 1985.
[20] Mattern, C., and Hennecke, D. K., “Influence of Rotation on Impingement Cooling,” ASME 41st International Gas Turbine and Aeroengine Congress and Exposition, Barcelona, Spain, ASME Paper No. GT-1996-161, 1996.
[21] Brevet, P., Dejeu, C., Dorignac, E., Jolly, M., and Vullierme, J. J., “Heat Transfer to a Row of Impinging Jets in Consideration of Optimization,” International Journal of Heat and Mass Transfer, Vol. 45, pp. 4191-4200, 2002.
[22] Brevet, P., Dorignac, E., and Vullierme, J. J., “Mach Number Effect on Jet Impingement Heat Transfer,” Annals of the New York Academy of Sciences, Heat Transfer in Gas Turbine Systems, Vol. 934, pp. 409-416, 2001.
[23] Lee, D. H., Song, J., and Jo, M. C., “The Effects of Nozzle Diameter on Impinging Jet Heat Transfer and Fluid Flow,” ASME Transactions – Journal of Heat Transfer, Vol. 126, No. 4, pp. 554-557, 2004.
[24] Garimella, S. V., and Nenaydykh, B., “Nozzle-Geometry Effects in Liquid Jet Impingement Heat Transfer,” International Journal of Heat and Mass Transfer, Vol. 39, No. 14, pp. 2915-2923, 1996.
[25] Shuja, S. Z., Yilbas, B. S., and Budair, M. O., “Influence of Conical and Annular Nozzle Geometric Configurations on Flow and Heat Transfer Characteristics Due to Flow Impingement Onto a Flat Plate,” Numerical Heat Transfer; Part A: Applications, Vol. 48, No. 9, pp. 917-939, 2005.
[26] Siba, E. A., Ganesa-Pillai, M., Harris, K. T., and Haji-Sheikh, K., “Heat Transfer In a High Turbulence Air Jet Impinging Over a Flat Circular Disk,” ASME Transactions – Journal of Heat Transfer, Vol. 125, No. 2, pp. 257-265, 2003.
[27] Chung, Y. M., and Luo, K. H., “Unsteady Heat Transfer Analysis of an Impinging Jet,” ASME Transactions – Journal of Heat Transfer, Vol. 124. No. 6, pp. 1039-1048, 2002.
[28] Abdon, A., and Sundén, B., “Numerical Investigation of Impingement Heat Transfer Using Linear and Non-Linear Two-Equation Turbulence Models,” Numerical Heat Transfer; Part A: Applications, Vol. 40, No. 6, pp. 563-578, 2001.
[29] Tong, A. Y., “A Numerical Study on the Hydrodynamics and Heat Transfer of a Circular Liquid Jet Impinging Onto a Substrate,” Numerical Heat Transfer; Part A: Applications, Vol. 44, No. 1, pp. 1-19, 2003.
[30] Laschefski, H., Cziesla, T., Biswas, G., and Mitra, N. K., “Numerical Investigation of Heat Transfer By Rows of Rectangular Impinging Jets,” Numerical Heat Transfer; Part A: Applications, Vol. 30, No. 1, pp. 87-101, 1996.
[31] Seyedein, S. H., Hasan, M., and Mujumdar, A. S., “Turbulent Flow and Heat Transfer From Confined Multiple Impinging Slot Jets,” Numerical Heat Transfer; Part A: Applications, Vol. 27, No. 1, pp. 35-51, 1995.
[32] Rhee, D. H., Yoon, P. H., and Cho, H. H., “Local Heat/Mass Transfer and Flow Characteristics of Array Impinging Jets With Effusion Holes Ejecting Spent Air,” International Journal of Heat and Mass Transfer, Vol. 46, No. 6, pp. 1049-1061, 2003.
[33] Park, J., Goodro, M., Ligrani, P. M., Fox, M., and Moon, H. –K., “Separate Effects of Mach Number and Reynolds Number on Jet Array Impingement Heat Transfer,” ASME Transactions-Journal of Turbomachinery, Vol. 129, No. 2, 2007.
[34] Park, J., Goodro, M., Ligrani, P. M., Fox, M., and Moon, H. –K., “Effects of Mach Number and Reynolds Number on Jet Array Impingement Heat Transfer,” International Journal of Heat and Mass Transfer, Vol. 50, No. 1, pp. 367-380, 2007.
[35] Goodro, M., Park, J., Ligrani, P. M., Fox, M., and Moon, H. –K. “Effects of Hole Spacing on Spatially-Resolved Jet Array Impingement Heat Transfer,” International Journal of Heat and Mass Transfer, Vol. 51, Nos. 25-26, pp. 6243-6253, 2008.
[36] Goodro, M., Park, J., Ligrani, P. M., Fox, M., and Moon, H. –K., “Effect of Temperature Ratio on Jet Array Impingement Heat Transfer,” ASME Transactions-Journal of Heat Transfer, Vo. 131, No. 1, pp. 012201-1 to 12201-10, 2009.
[37] Goodro, M., Ligrani, P. M., Fox, M., and Moon, H. –K., “Mach Number, Reynolds Number, Jet Spacing Variations: Full Array of Impinging Jets,” AIAA Journal of Thermophysics and Heat Transfer, Vol. 24, No. 1, pp. 133-144, 2010.
[38] Park, J., Goodro, M., Ligrani, P. M., Fox, M., and Moon, H. –K., “Separate Effects of Mach Number and Reynolds Number on Jet Array Impingement Heat Transfer,” Paper Number GT2006-90628, 51st ASME TURBO EXPO Gas Turbine and Aeroengine Technical Congress, Exposition, and Users Symposium, Barcelona, Spain, 2006.
[39] Goodro, M., Park, J., Ligrani, P. M., Fox, M., and Moon, H. –K., “Effect of Temperature Ratio on Jet Array Impingement Heat Transfer,” Paper Number GT2007-28293, 52nd ASME TURBO EXPO Gas Turbine and Aeroengine Technical Congress, Exposition, and Users Symposium, Montreal, Canada, 2007.
[40] Goodro, M., Park, J., Ligrani, P. M., Fox, M., and Moon, H. –K., “Effects of Hole Spacing on Jet Array Impingement Heat Transfer,” Paper Number GT2007-28292, 52nd ASME TURBO EXPO Gas Turbine and Aeroengine Technical Congress, Exposition, and Users Symposium, Montreal, Canada, 2007.
[41] Goodro, M., Ligrani, P. M., Fox, M., and Moon, H. –K., “Effects of Mach Number, Reynolds Number, and Jet Spacing on Surface Heat Transfer for a Full Array of Impinging Jets,” TURBINE09 – International Symposium on Heat Transfer in Gas Turbine Systems, Antalya, Turkey, 2009.
[42] Lee, J., Ren, Z., Haegele, J., Potts, G., Jin, J. S., Ligrani, P. M., Fox, M., and Moon, H. –K., “Effects of Jet-To-Target Plate Distance and Reynolds Number on Jet Array Impingement Heat Transfer,” Paper Number GT2013-94651, 58th ASME TURBO EXPO Gas Turbine Technical Congress and Exposition, San Antonio, Texas, USA, 2013. Also to appear in the ASME Transactions-Journal of Turbomachinery.
(a)
(b)
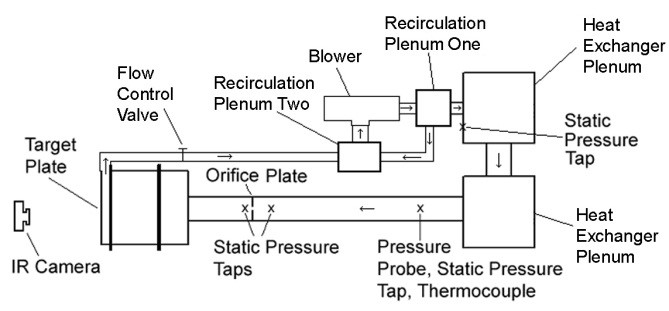
Figure 1. Impingement investigations experimental facility [33-37]. (a) Component arrangement for Mach number, Reynolds number, and hole spacing investigations. (b) Component arrangement for temperature ratio investigations.
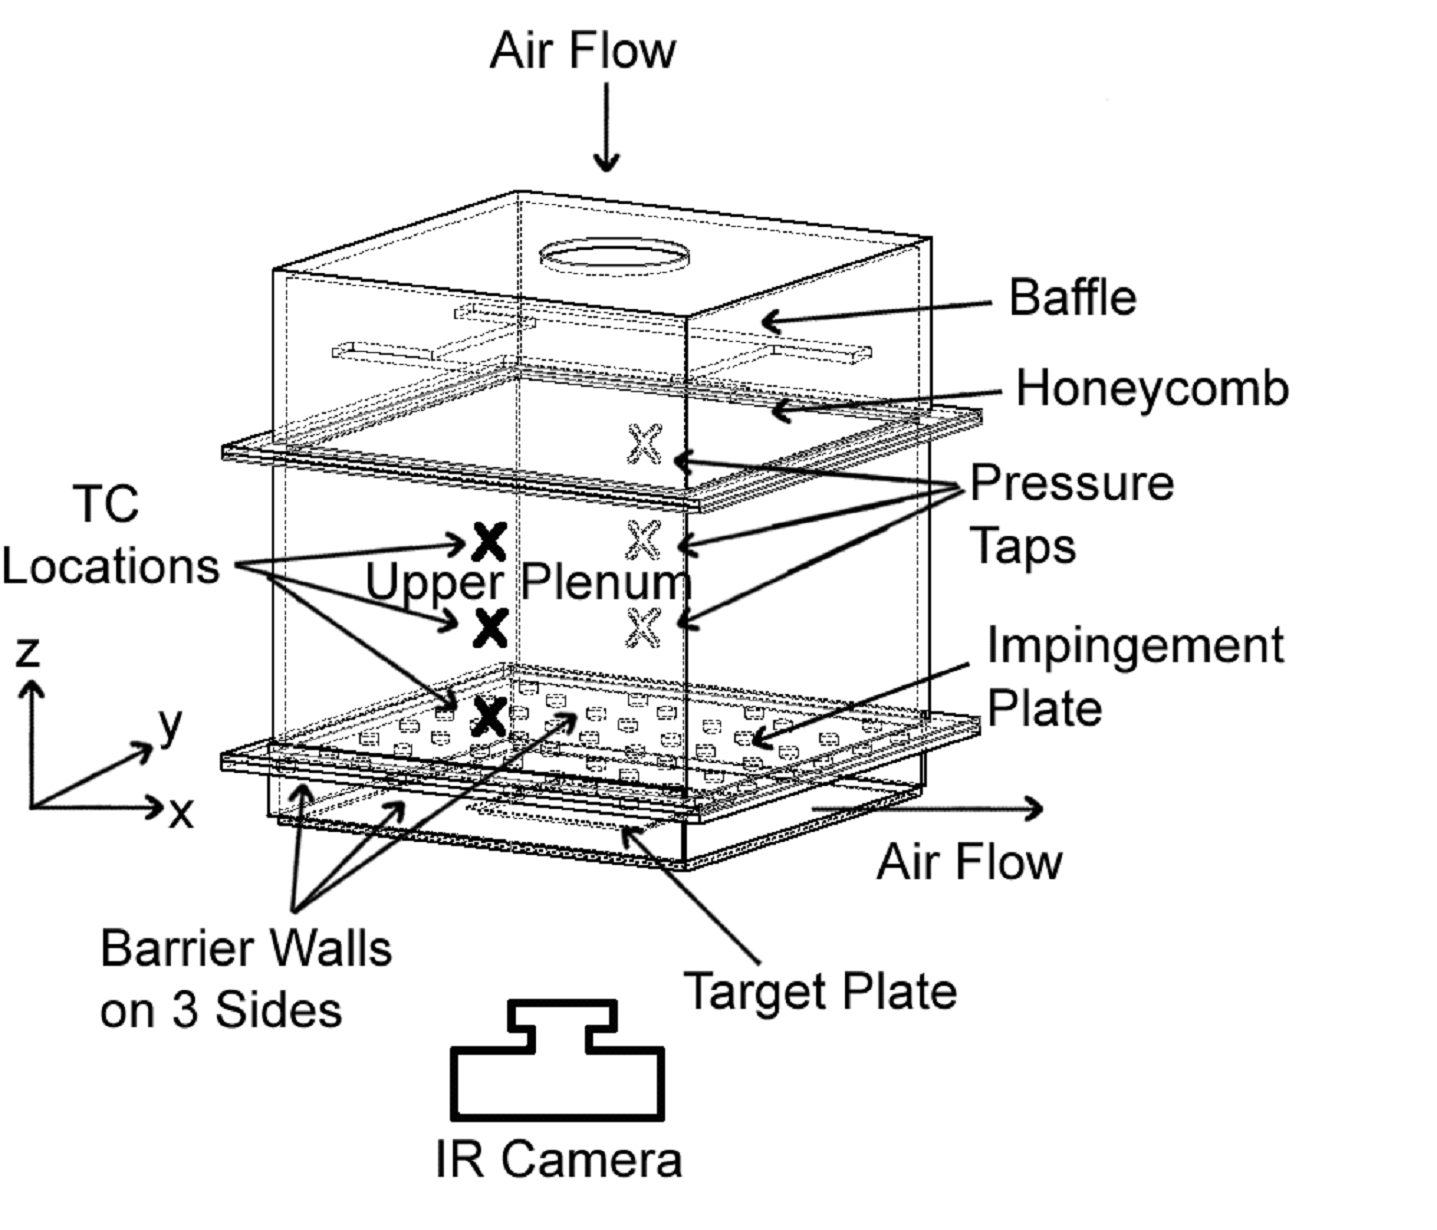
Figure 2. Impingement flow facility test section, including impingement plenum, and impingement channel [33-37].
(a)
(b)
(c)
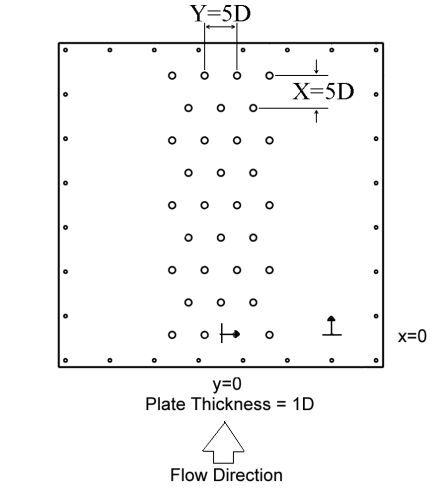
Figure 3. Impingement test plate configurations [37]. (a) X/D=Y/D=5. (b) X/D=Y/D=8. (c) X/D=Y/D=12.
(a)
(b)
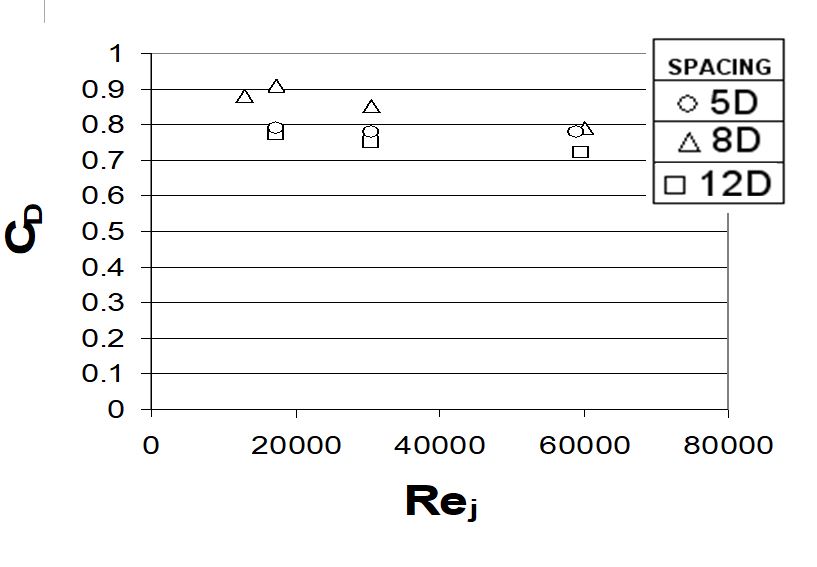
Figure 4. (a) Crossflow-to-jet mass velocity ratio with row number for hole spacings of 5D, 8D, and 12D and (b) discharge coefficient coefficient varations with Rej for hole spacings of 5D, 8D, and 12D at constant Mach number 0.2 [37].
(a) Ma=0.16
(b) Ma=0.21
(c) Ma=0.38
(d) Ma=0.63
(e) Ma=0.74
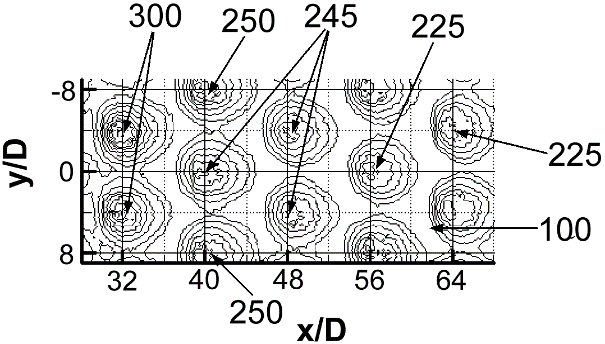
Figure 5. Spatially-resolved distributions of surface Nusselt number for Rej=60000 and Ma values of: (a) 0.16, (b) 0.21, (c) 0.38, (d)0.63 and (e) 0.74 [34].
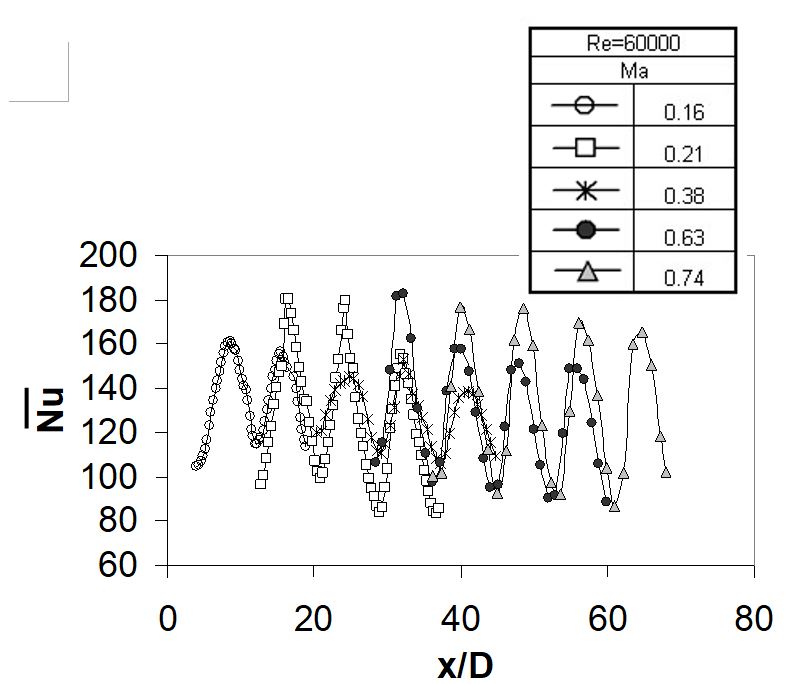
Figure 6. Surface Nusselt number variations with x/D, which are line-averaged over y/D from -8.0 to +8.0, for Rej=60000 and Ma values of 0.16, 0.21, 0.38, 0.63, and 0.74 [34].
(a)
(b)
(c)
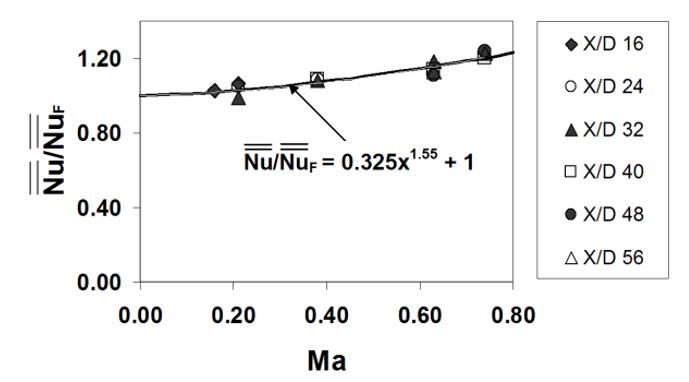
Figure 7. Comparison of spatially averaged Nusselt numbers with correlation of Florschuetz et al. [9]. (a) Data for Ma=0.10, and Rej values of 5200, 6400, and 8200. (b) Data for Rej=60000 and Ma values of 0.16, 0.21, 0.38, 0.63, and 0.74. (c) Nusselt number data at specific x/d locations correlated with respect to Mach number [34].
(a)
(b)
(c)
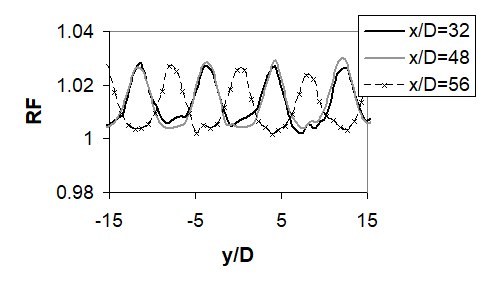
Figure 8. Recovery factor data for Rej=60000 and Ma=0.74. (a) Local surface recovery factor distribution. (b) Local surface recovery factor data as it varies with x/D for y/D=0, 4, and 8. (c) Local surface recovery factor data as it varies with y/D for x/D=32, 48, and 56 [34].
(a)
(b)
(c)
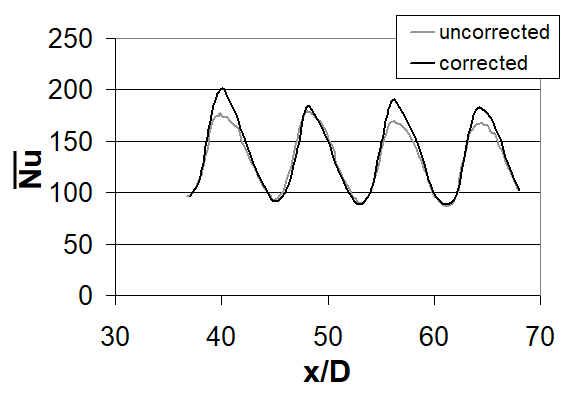
Figure 9. Corrected and uncorrected surface Nusselt number data for Rej=60000 and Ma=0.74. (a) Local corrected surface Nusselt number distribution. (b) Local surface Nusselt number data as it varies with x/D for y/D=0. (c) Surface Nusselt number variations with x/D which are line-averaged over y/D from -8.0 to +8.0 [34].
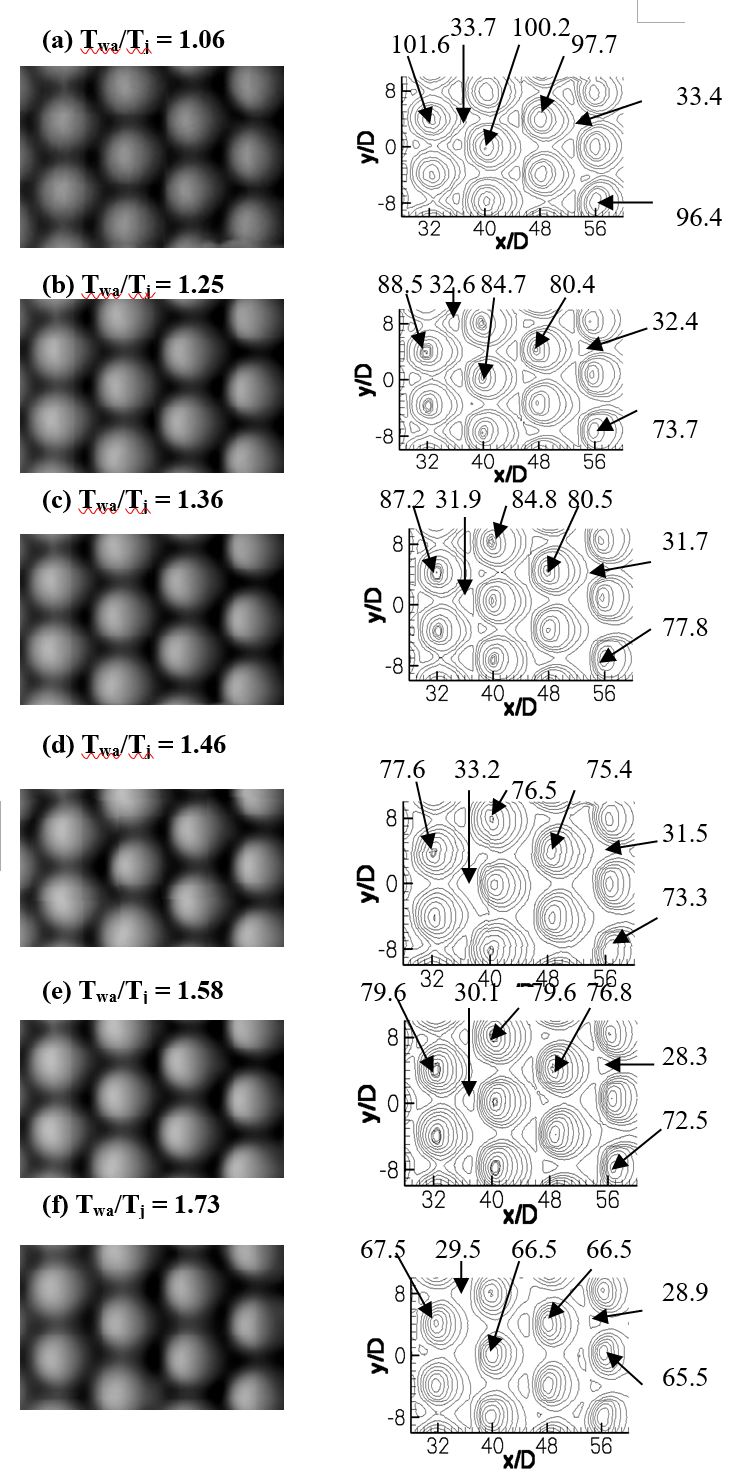
Figure 10. Spatially-resolved surface Nusselt number distributions for Rej=18000, Ma=0.2, and Twa/Tj = 1.06, 1.25, 1.36, 1.46, 1.58 and 1.73 [36].
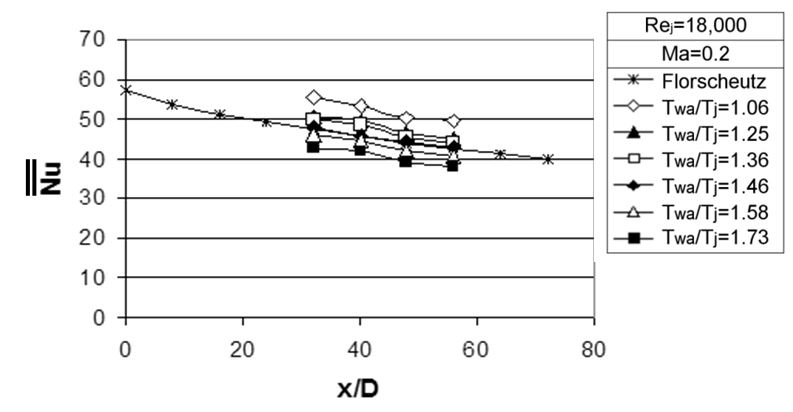
Figure 11. Spatially-averaged Nusselt numbers as dependent upon x/D for Rej=18000, Ma=0.2, and Twa/Tj = 1.06, 1.25, 1.36, 1.46, 1.58 and 1.73 [36].
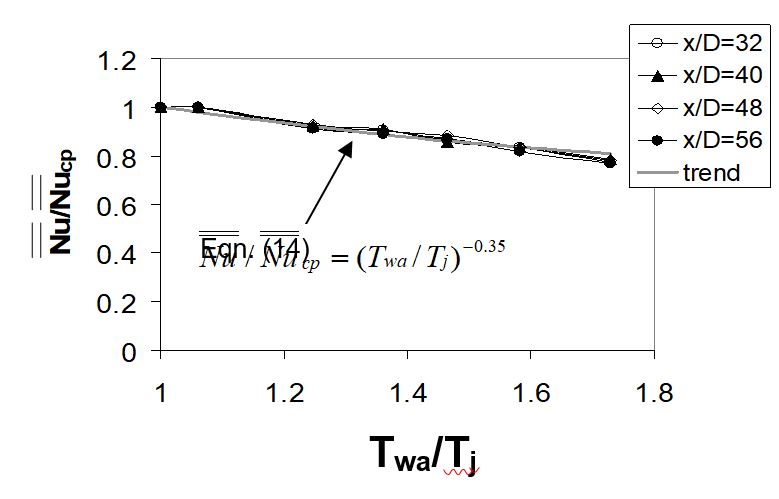
Figure 12. Nusselt numbers ratio data at specific x/D locations correlated with respect to temperature ratio, Twa/Tj [36].
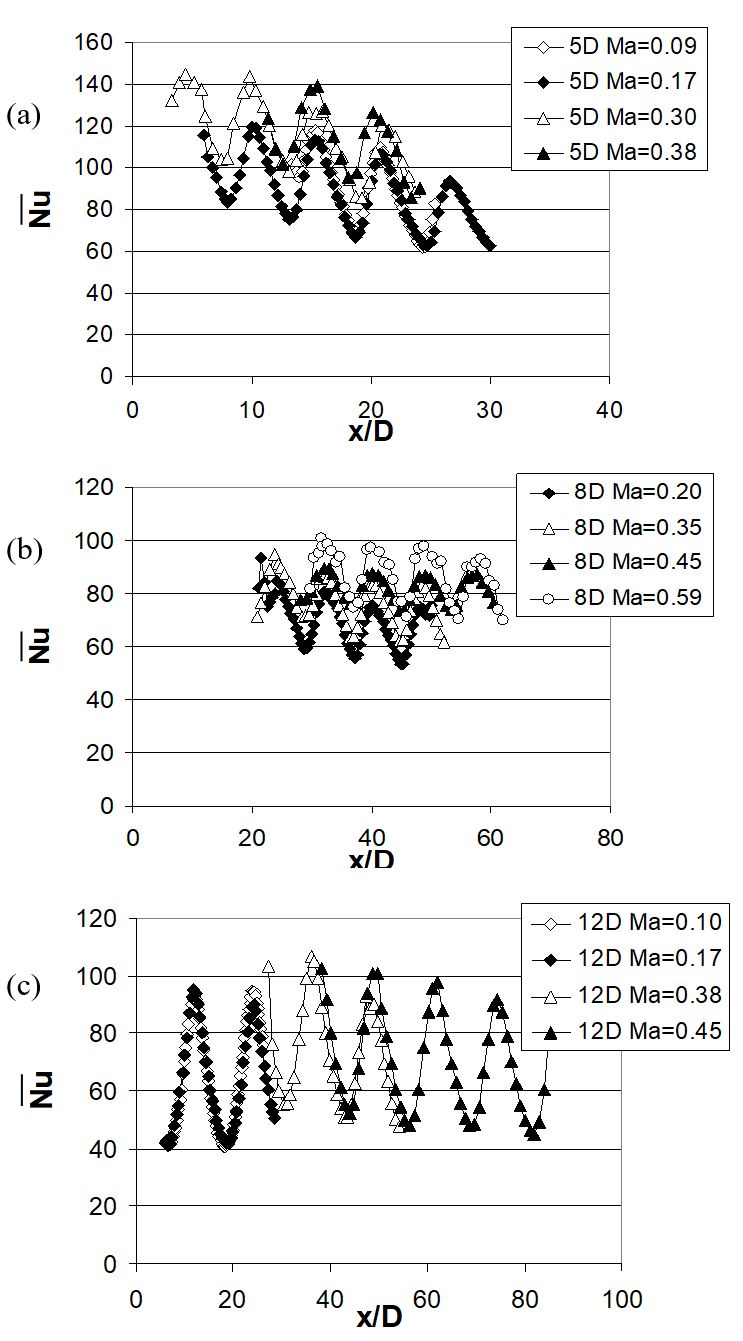
Figure 13. Surface Nusselt number variations which are line-averaged over y/D for one hole spacing in either direction from the origin for constant Reynolds number 30000 and (a) hole spacing 5D Ma=0.09, 0.17, 0.30, and 0.38, (b) hole spacing 8D Ma=0.20, 0.35, 0.45, and 0.59, (c) hole spacing 12D Ma=0.10, 0.17, 0.38, and 0.45 [37].
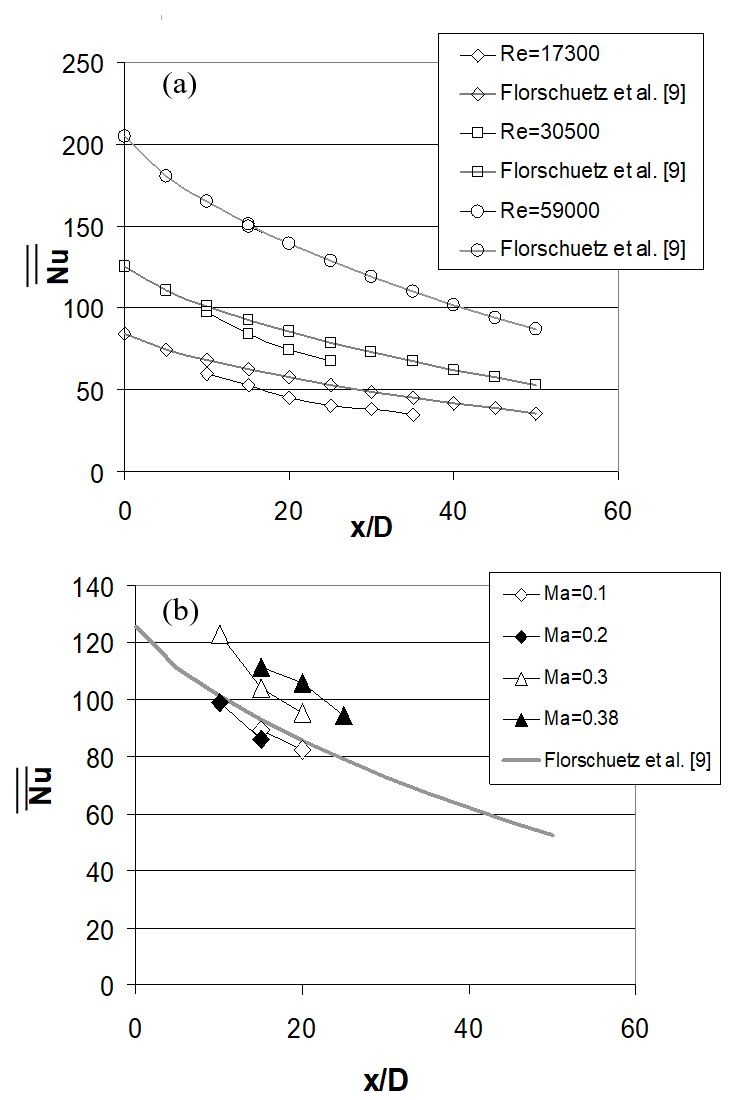
Figure 14. Hole spacing X/D=Y/D=5 comparison of area-averaged Nusselt numbers with correlation of Florschuetz et al. [9]. (a) Data for Ma=0.17, and Rej=17300, 30000, and 59000. (b) Data for Rej=30,000 and Ma values of 0.1, 0.17, 0.30, and 0.38 [37].
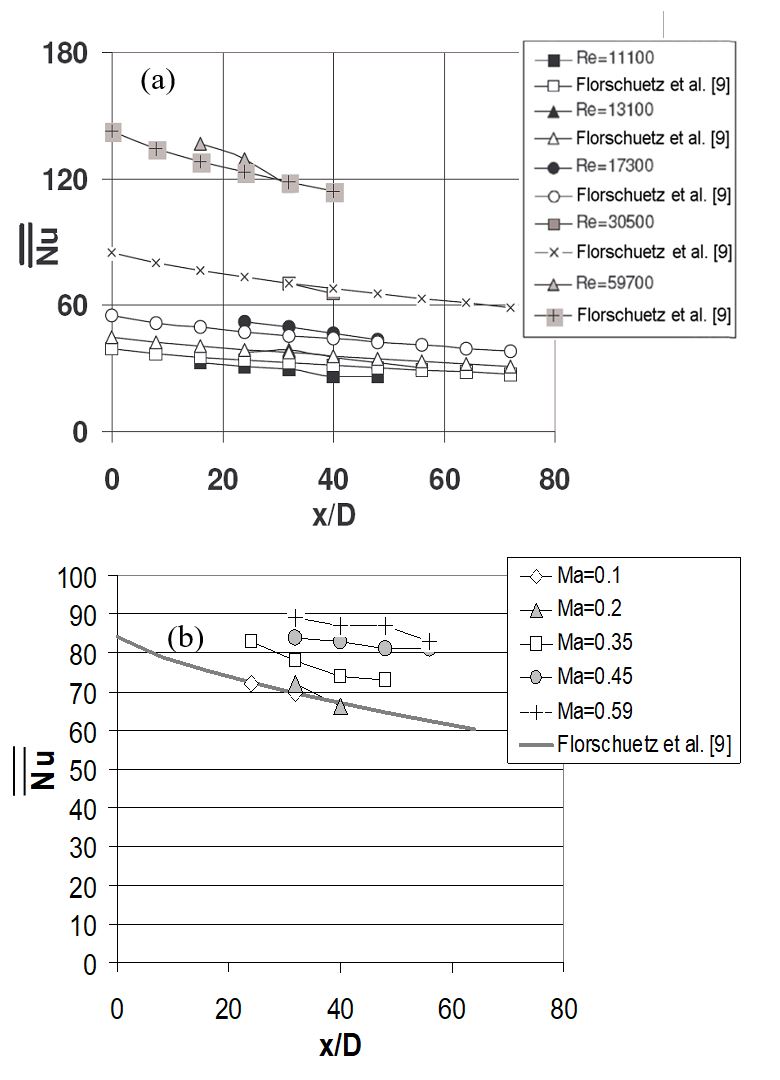
Figure 15. Hole spacing X/D=Y/D=8 comparison of area-averaged Nusselt numbers with correlation of Florschuetz et al. [9]. (a) Data for Ma=0.2, and Rej=17300, 30000, and 59000. (b) Data for Rej=30,000 and Ma values of 0.1, 0.2, 0.35, 0.45, and 0.59 [37].
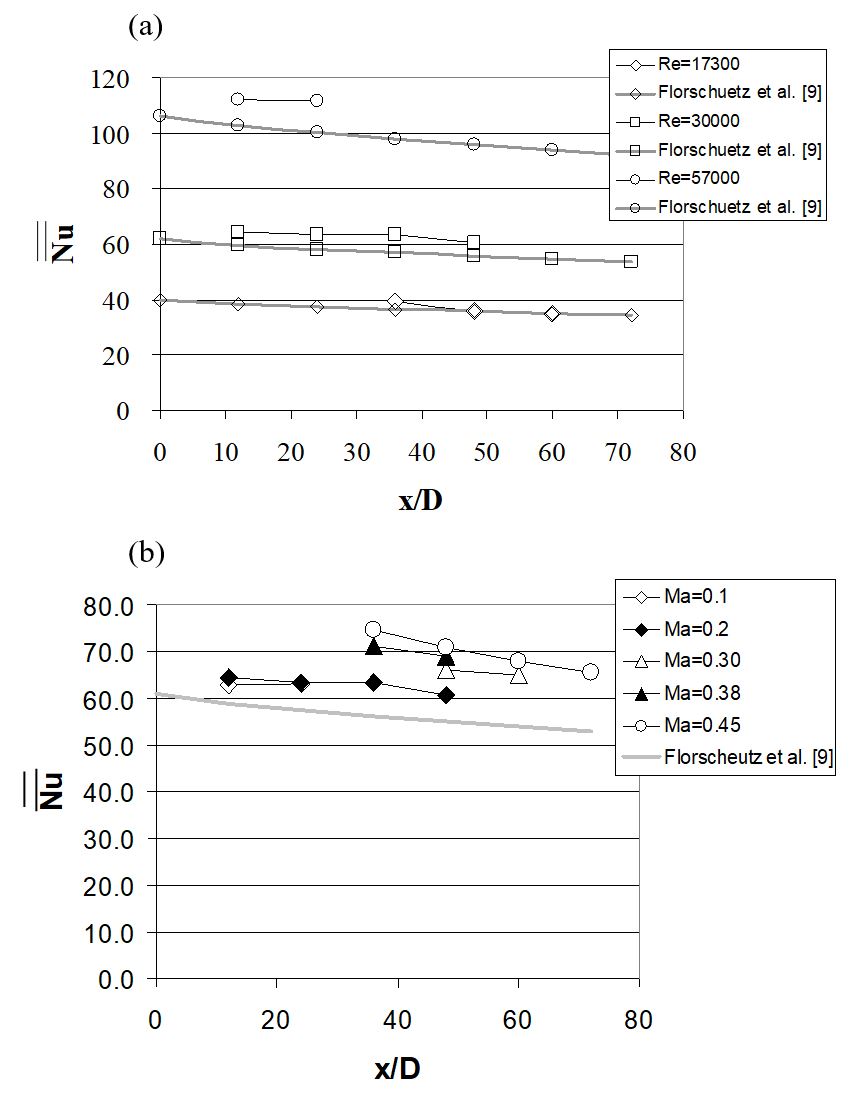
Figure 16. Hole spacing X/D=Y/D=12 comparison of area-averaged Nusselt numbers with correlation of Florschuetz et al. [9]. (a) Data for Ma=0.2, and Rej=17300, 30000, and 59000. (b) Data for Rej=30,000 and Ma values of 0.1, 0.2, 0.35, 0.38, and 0.45 [37].
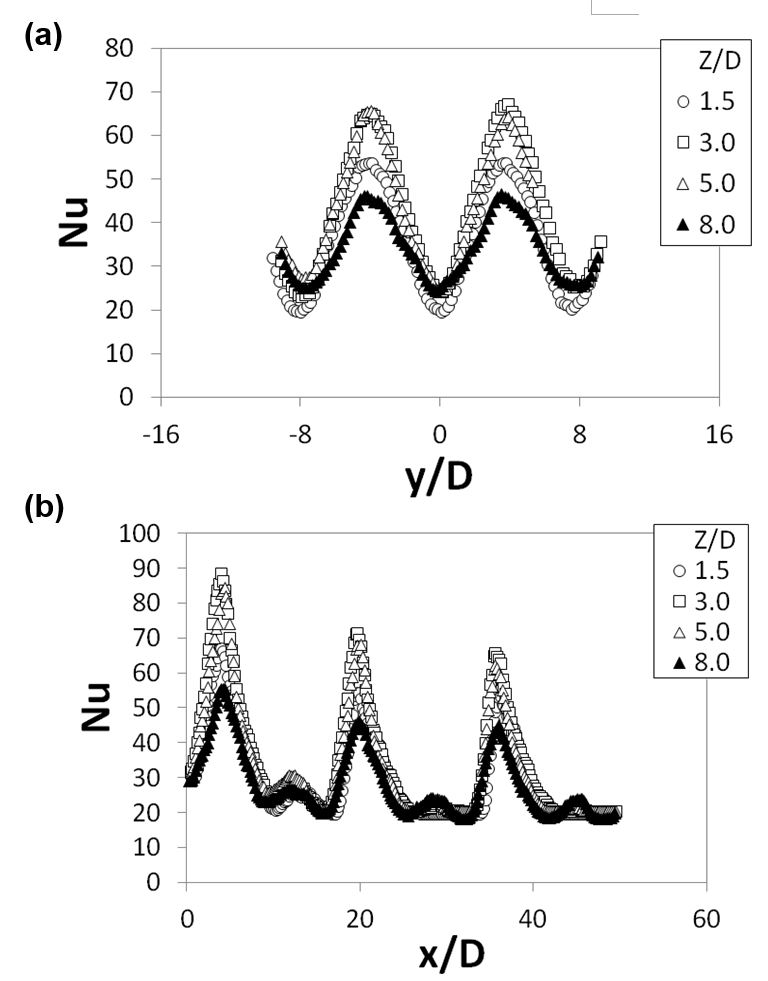
Figure 17. Local Nusselt number variations for Rej≈8,200 for different Z/D values and X/D=Y/D=8. (a) Variations with y/D for x/D=20. (b) Variations with x/D for y/D=4 [42].
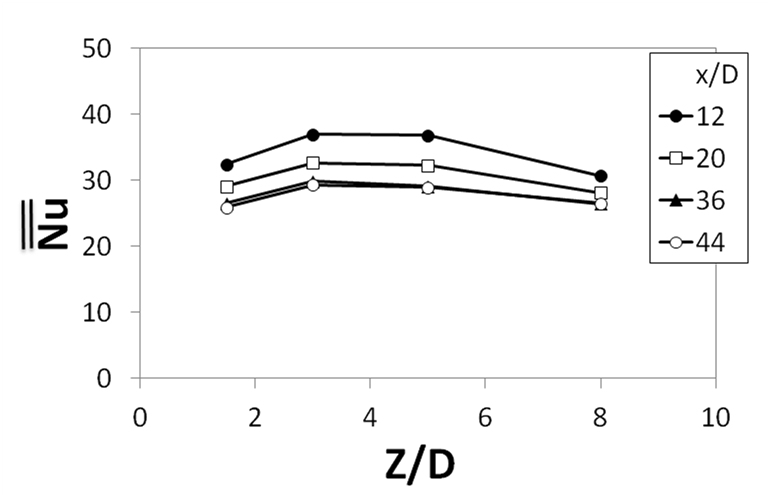
Figure 18. Spatially-averaged Nusselt numbers as dependent upon Z/D for Rej≈8,200 and X/D=Y/D=8 [42].