– Impingement Cooling
– Impingement Jet Array Heat Transfer With Surface Textures
– Surface Roughness Characterization and Analysis
– Dimple Surface Arrays
– Swirl Chambers
– Surface Heat Transfer Augmentation Within Internal Passages
– Film Cooling
– Full-Coverage Film Cooling
– Double Wall Cooling
– Second Law Analysis of Film Cooling
– Aerodynamic Losses From Turbine Airfoils
– Transonic Turbine Blade Tips
– Transonic Turbine Blade Tips With Film Cooling
– Transonic Turbine Alloy Blades
– Supersonic Flow Experimental Results
– Shock Wave Unsteady Interactions
– Viscous Dissipation Within a Transonic Flow Environment
– Transitional Flows in Curved Channels
– Dean Flow Dynamics in Low-Aspect Ratio Spiral Microchannels
– Unsteady Laminar Impinging Slot Jets
– Electronics Cooling
– Miniature and Micro-Scale Pumps
– Slip Rarefaction Phenomena
– Elastic Instabilities
– Buoyancy-Driven Continuous SPLITT Fractionation
FULL-COVERAGE FILM COOLING
Full-Coverage Film Cooling
Abstract
To illustrate forced convection, external flow effects and phenomena, considered are full coverage effusion cooling arrangements. Parameters and phenomena considered include: (1) blowing ratio BR, (2) magnitude of main flow stream wise static pressure gradient (quantified by mainstream passage contraction ratio Cr values of 1, 3, 4, and 5), (3) stream wise development (quantified by variations with x/D), (4) effusion cooling hole inclination angle α, and (5) effusion hole spacing, ranging from dense to sparse (characterized by X/D values of 6 and 18, and Y/D values of 3, 5, and 7). As such, the film cooling holes in adjacent stream wise rows are staggered with respect to each other, with sharp edges, and stream wise inclination angles of either 20 degrees or 30 degrees, with respect to the liner surface. Data are provided for turbulent film cooling, blowing ratios (at the test section entrance) of 2.0, 5.0, and 10.0, coolant Reynolds numbers of 12,000 for BR=5.0, freestream temperatures from 75ºC to 115ºC, a film hole diameter of 7 mm, and density ratios from 1.15 to 1.25. Data include local, line-averaged and spatially-averaged adiabatic film effectiveness data, and local, line-averaged and spatially-averaged heat transfer coefficient data. Varying blowing ratio values are utilized along the length of the contraction passage, which contains the cooling hole arrangement, when contraction ratio is different from 1. Dependence on blowing ratio indicates important influences of coolant concentration and distribution. For example, line-averaged and spatially-averaged adiabatic effectiveness data show vastly different changes with blowing ratio BR for the configurations with contraction ratios of 1 and 4. These changes from acceleration are thus mostly due to different blowing ratio distributions along the test section
1. INTRODUCTION
Full-coverage film cooling or effusion cooling is employed in a variety of applications to manage heat loads, by providing a layer of coolant which acts as a heat sink, as well as an insulating layer between the hot gas freestream and the surface which is intended to be cooled. The present results are focussed on heat management using full-coverage film cooling as applied to gas turbine component design, where gas operating temperatures often exceed safe working temperatures of the materials employed. The mainstream contraction arrangement, utilized in the investigations of Ligrani et al. (2012, 2013, 2015), is employed to simulate flow in a typical axial flow combustor as it passes through a film-cooled contraction.
As such, an important component of the present investigation is consideration of changing static pressure in the mainstream flow along the length of the full-coverage film cooling array. Aside from the investigations which are the focus of this article, only Sasaki et al. (1979), and Scrittore et al. (2007) consider such an arrangement. These investigations also generally employ high blowing ratios and dense hole arrays. For Sasaki et al. (1979), and Scrittore et al. (2007), changes in static pressure are produced by increasing freestream velocity which results from the volumetric addition of coolant into constant area ducts, after it leaves the film cooling holes. With the constant passage area and film volumetric addition arrangement employed by Scrittore et al. (2007), a drop in blowing ratio of roughly 20 percent from the first row of holes to the twentieth row is reported.
Leger et al. (2002) consider a range of hole angles with a 30º hole angle plate. The authors generally report an increase in effectiveness with increasing blowing ratio. After the first few rows of cooling holes, the changes in effectiveness from one row to the next are approximately equal for each blowing ratio. Lin et al. (2003) show that, for a range of blowing ratios from 1 to 4 and hole spacings of X/D=8, Y/D=4 and X/D=5.67, Y/D=5.67, holes inclined in the direction of the freestream show negligible performance change with increasing blowing ratio. Furthermore, they indicate blowing ratios in the inclined multi-hole liner of a gas turbine combustor range from 2 to 10.
The present article is based upon results which are presented by Ligrani et al. (2012, 2013, 2015). These investigations are unique because of the use of a contraction flow arrangement for the main passage flow. As mentioned, such a configuration results in significant variations of streamwise static pressure for the different blowing ratios and different film cooling arrays, which are typical of gas turbine combustors. As a result, the constant pressure film cooling fluid source, and the free-stream static pressure drop through the contraction, cause a change in blowing ratio along the length of the contraction. This is due to varying mass fluxes in both the freestream and the coolant flows. The present authors know of no other data from other sources for similar combustor liner array configurations at different blowing ratios. As such, the present study is undertaken using a unique experimental facility which was designed and assembled especially for the investigation. With this apparatus, experimental data are obtained with full-coverage film cooling over the entire length of the contraction. Note that the changes in static pressure which are employed by Ligrani et al. (2012, 2013, 2015) are more significant than the ones reported by either Sasaki et al. (1979) or Scrittore et al. (2007).
Parameters and phenomena considered include: (1) blowing ratio BR, (2) magnitude of main flow stream wise static pressure gradient (quantified by mainstream passage contraction ratio Cr values of 1, 3, 4, and 5), (3) stream wise development (quantified by variations with x/D), (4) effusion cooling hole inclination angle α, and (5) effusion hole spacing, ranging from dense to sparse (characterized by X/D values of 6 and 18, and Y/D values of 3, 5, and 7). As such, data are given for three blowing ratios of 2.0, 5.0, and 10.0, where each designated value is given for the entrance of the test section. Note that Cr values of 3, 4, and 5 correspond to situations with significant stream wise acceleration through the test section. Film cooling holes are sharp-edged, and stream wise inclined at inclination angles of either 20o or 30o with respect to the liner surface. Coolant Reynolds number Refc is 12,000 for a blowing ratio of 5.0, freestream temperatures range from 75ºC to 115ºC, the film hole diameter is 7 mm, and density ratios range from 1.15 to 1.25. The film is turbulent for all experimental conditions investigated. Presented are blowing ratio distributions, local, line-averaged, and spatially-averaged adiabatic film effectiveness, and local, line-averaged, and spatially-averaged heat transfer coefficients. The resulting data are useful as an aid to designers of gas turbine components, as well as for the development and validation of codes for numerical prediction of such component flows.
3. EXPERIMENTAL APPARATUS AND PROCEDURES, FILM COOLING TEST SECTION CONFIGURATION
The experimental apparatus and procedures are described by Ligrani et al. (2012, 2013, 2015).
A schematic diagram of the test section segment is shown in Figure 1. This figure shows the inclined film cooled surface, the opposite wall which provides flow containment and window ports for the infrared camera, the film cooling flow inlet and the film cooling flow source chamber. The inclined film cooled surface consists of a frame and a test surface. The free-stream pressure drop through the mainstream contraction, combined with a constant pressure cooling fluid source, causes a change in blowing ratio along the length of the contraction due to the varying mass flux in both the freestream and the coolant flows. The first row of film cooling holes is located 59.8 mm downstream of the inlet to the contraction. The frame to mount the film cooling plate is made from 20 mm Perspex. It is held in place by a pin hinge in the upstream end and is bolted to a Perspex spanner on the downstream end. It is surrounded by gasket material embedded in a machined groove. Additionally there are 8 L-shape brackets on the top and bottom of the frame that prevent flexing in the presence of a pressure difference between the bulk flow side and the film cooling flow source chamber. The frame, test surface, Perspex spanner, and outside wall form the film cooling flow source chamber. This chamber is connected to the cased axial fan with five 8 cm diameter flexible tubes. Because the volume and cross-section of the chamber are much larger than the area of the film cooling holes, the velocity in this part of the test section is approximately zero. This is an important approximation when determining the film cooling hole exit velocity using the Bernoulli equation. The wall opposite the film cooled surface has 8 ports spaced in such a way that the entire test surface can be imaged.
The film cooling flow is controlled by a valve that reduces the flow to the desired volume. For higher flow rates, the supplemental fans are used. For fine control at high flow rates, a potentiometer is employed to control the motor speed. Prior to the beginning of the film cooling surface there is a knife bleed to minimize boundary layer effects generated by the inlet bell mouth, heater mesh, and combustor liner test section entry length.
The film cooling test surfaces are all made from 20 mm Perspex (thermal conductivity of approximately 0.14 W/mK) with hole diameters of 7 mm. The usable test surfaces measure 400 mm by 1680 mm. The leading edge of the first row of film cooling holes is 59.8 mm from the leading edge of the test surface, giving 240 hole diameters of length before the end of the test surface. These dimensions were chosen because 7 mm is the smallest hole diameter that can be used without producing compressibility effects for at least one test case. The present study employs one film cooling test surface. Figure 2a shows a test plate with a sparse hole array with X/D=18 and Y/D=5. Figure 2b then shows a test plate with a dense hole array with X/D=6 and Y/D=5. Hole angle inclination is 20º relative to the test surface The length-to-diameter ratio of the film holes is 8.35 for α=20º. Figure 2c shows the test section coordinate system. The height of the test section at its inlet is 420 mm.
4. EXPERIMENTAL RESULTS
4.1 Blowing ratio variations
Figure 3 presents variations of blowing ratio with stream wise location for two contraction ratio values of Cr=1 and Cr=4. Note that the blowing ratio reported is the initial blowing ratio for the first row of holes, and that each data set is characterized in terms of this blowing ratio and the contraction ratio. When Cr=4, the blowing ratio decreases in magnitude with increasing x/D for each of the three blowing ratios considered. This is partially a result of the increase in freestream velocity with stream wise location. Also present is an increase in film cooling exit velocity with x/D. The resulting drop in blowing ratio ranges from 1.6 percent for the case BR=2, Cr=1, to approximately 75 percent for the case BR = 10, Cr = 4 for locations which range from the 1st to the 13th rows of holes.
4.2 Contraction ratio effects on mainstream acceleration and variation of coolant mass flow rate
Figure 4 shows variations of acceleration parameter K through the test section for contraction ratios Cr of 1, 3, 4, and 5. Here, the acceleration parameter K is given by
Acceleration parameter K values for Cr=1 are in the vicinity of 1×10⁻⁶, whereas K values for Cr=4 range from 1×10⁻⁶ to 2.7×10⁻⁶.
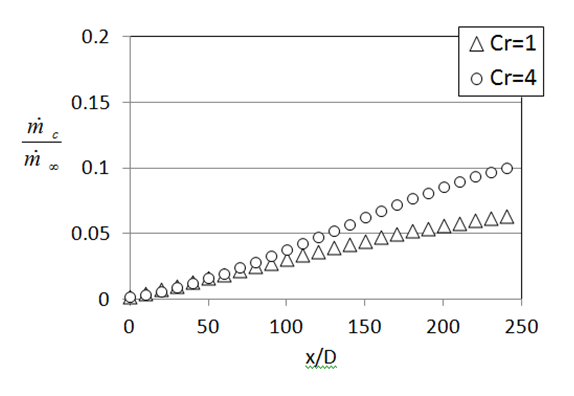
The variation of coolant mass flow rate per unit of mainstream mass flow rate is shown in Fig. 5a for X/D=18, Y/D=5, a blowing ratio BR of 5.0, and contraction ratios Cr values of 1 and 4, and in Fig. 5b for X/D=6, Y/D=5, a blowing ratio BR of 5.0, and contraction ratios Cr values of 1, 3, 4, and 5. Note that the magnitude of employed to normalize these data is the freestream value at the inlet of the test section. The large amounts of film required for cooling are illustrated by this figure. For example, within Fig. 5a, when Cr=1, the total sum of all coolant relative to the bulk flow is 0.06, whereas for Cr=4, the total sum of all coolant relative to the bulk flow is approximately 0.10. The approximately linear increase of with x/D is due to the dominating influence of continual accumulation of increased amounts of coolant from additional successive rows of holes along the test section. The deviations from linearity are a result of local increases of coolant supply pressure differential (and decreasing freestream static pressure) with x/D.
4.3 Blowing ratio effects on adiabatic film effectiveness for a sparse hole array.
Figure 6 presents local, spatially-resolved adiabatic effectiveness data, for a blowing ratio BR value of 10.0. These data are given for a contraction ratio Cr of 4 and hole inclination angle of 20o. Figure 8 then gives line-averaged adiabatic effectiveness values for a contraction ratio Cr of 1 for BR values of 2.0, 5.0, and 10.0. Figure 9 subsequently presents spatially-averaged adiabatic effectiveness values for the same configuration and conditions. Note that these configurations and conditions are representative of those used in modern gas turbine applications (Sasaki et al., 1979; Leger et al., 2002; Lin et al., 2003; Scrittore et al., 2007).
The local, spatially-resolved effectiveness data, presented in Fig. 6, are obtained from an instantaneous infrared image of the film cooled surface. As such, no temporal or spatial averaging is applied to these results. As a result, local variations are present in the distributions associated with different spatially-periodic film concentrations (which would not be present in time-averaged results). The data are presented for the most upstream part of the film cooled surface at x/D from 0 to 46-47. Within this figure, local concentrations of increased local effectiveness are apparent at the locations along the test surface which correspond to film hole exit locations. A stream wise pattern of increased effectiveness is then apparent along a path which emanates downstream of each of these film holes. In some cases, these paths of increased η are narrowed just downstream of individual holes, providing evidence of partial lift-off of film concentrations from the test surface. In general, regions of locally higher effectiveness cover larger spatial extents as x/D increases, and film concentrations accumulate in a sequential fashion downstream of additional stream wise rows of holes.
With blowing ratios of 2.0, 5.0, and 10.0, examination of Fig. 8 shows the development of a protective film between the first, second, and third rows of holes for X/D=18 and Y/D=5. There is then steady increase in the local effectiveness values for each of the blowing ratios until approximately the 6th row of holes (which is near x/D=108, noting that the first row of holes is located at x/D=0). Afterwards, further substantial effectiveness changes with stream wise development are minimal. Repeated local maxima are present in Fig. 7 for every x/D multiple of 18 because of stream wise hole spacing. Note that line-averaged effectiveness values are generally higher at each x/D location for the case BR=10.0 than for BR=5.0, with values for BR=5.0 generally higher than values for BR=2.0.
Overall variations with stream wise development and blowing ratio are further exemplified by the spatially-averaged data which are presented in Fig. 9. Within this figure, spatially-averaged effectiveness values are plotted with one data point representing the surface value associated with area for each row of effusion holes. As such, these data points each represent effectiveness values averaged over an area from one half of the hole spacing value upstream to one half of the hole spacing value downstream of a particular row, and two full hole spacings in the span wise direction.
Within Fig. 9, spatially-averaged effectiveness data for blowing ratio BR values of 2.0, 5.0, and 10.0 and Cr=1 are generally about constant with x/D, and about the same magnitude at each x/D location (regardless of BR value), when normalized stream wise location x/D is greater than 150. Spatially-averaged effectiveness values then seem to increase somewhat with blowing ratio at each x/D location, for smaller x/D values. At far downstream locations, such behaviour evidences abundant coolant distributions along the test surfaces.
4.4 Blowing ratio effects on heat transfer coefficients for a sparse hole array.
Figure 7 presents local, spatially-resolved values of iso-energetic heat transfer coefficient for a blowing ratio BR value of 10.0. These data are given for a contraction ratio Cr of 4, a hole inclination angle of 20o, a stream wise hole spacing X/D of 18, and a span wise hole spacing Y/D of 5. Figure 9 then gives line-averaged heat transfer coefficient values for a contraction ratio Cr of 1 for blowing ratios BR of 2.0, 5.0, and 10.0. Figure 10 then presents spatially-averaged heat transfer coefficient values for the same configurations and conditions.
The local, spatially-resolved iso-energetic heat transfer coefficient data, presented in Fig. 7, are obtained from an instantaneous infrared image of the film cooled surface. As such, as mentioned, no temporal or spatial averaging is applied to these results. As a result, local variations are present in the distributions associated with different spatially-periodic film concentrations (which would not be present in time-averaged results). The data are presented for the most upstream part of the film cooled surface at x/D from 0 to approximately 46. Within these figures, local concentrations of decreased local heat transfer coefficients are apparent at the locations along the test surface which correspond to film hole exit locations. Patterns of increased heat transfer coefficient magnitudes are then often apparent around and upstream of each film hole, as well as along a path which emanates downstream of each of these film holes. The downstream augmentation regions are often located near the edges of the primary film concentrations. These augmented hc regions are associated with local increases of turbulent shear stress and turbulent transport within the film cooled boundary layers. In general, regions of locally higher hc cover larger spatial extents as x/D increases, and film concentrations accumulate in a sequential fashion downstream of additional stream wise rows of holes.
Within Figs. 10 and 11, line-averaged and spatially-averaged heat transfer coefficients are generally higher at certain locations because of the shear augmentations which occur as film cooling jets are ejected into the boundary layer. Here, complex interactions between different adjacent film jets and the boundary layer augment mixing and turbulent transport levels. The stream wise periodicity of the distributions, which is apparent in Fig. 10, is a result of local increased mixing as film is ejected from a row of holes.
Within Figs. 10 and 11 for Cr=1, heat transfer coefficient magnitudes generally cover the same ranges of values at each x/D location for all three blowing ratios, provided x/D<100. At larger x/D locations, heat transfer coefficient magnitudes at each x/D value generally increase as BR changes from 2.0 to 5.0, and as BR changes from 10.0 to 5.0. The lower heat transfer coefficients for BR=10 and x/D>100 are likely tied to the overabundance of coolant along the test surface, which appears to decrease local mixing and turbulent transport levels, compared to lower blowing ratio situations.
Spatially-averaged heat transfer coefficient values are also plotted with one data point representing values averaged over the area associated with each row of effusion holes within Fig. 11. These data points thus each represent heat transfer coefficient values averaged over an area from one half of the hole spacing value upstream to one half of the hole spacing value downstream of a particular row, and two full hole spacings in the span wise direction.
4.5 Contraction ratio and blowing ratio effects on adiabatic film effectiveness for a dense hole array
Figures 12 and 13 present spatially-averaged adiabatic film effectiveness data for blowing ratios BR of 5.0, and 10.0, respectively. Here, the comparisons are for varying contraction ratio Cr, as span wise hole spacing Y/D of 5, stream wise hole spacing X/D of 6, and streamwise hole inclination angle of 20o are all invariant. These data show that there is no substantial effectiveness change at each x/D when the blowing ratio is increased from 5.0 to 10.0. This indicates that shortly after the blowing ratio increases above some lower value, the surface reaches an overcooled state and no further improvement in cooling protection is possible by increasing the coolant mass flow rate. This negligible dependence on the blowing ratio for dense film cooling arrays agrees with the findings of Lin et al. (2003) and Scrittore et al. (2007), who also conclude that blowing ratio has a negligible effect on effectiveness for film cooling arrays with overly abundant accumulating coolant.
Within Figs. 12 and 13, spatially-averaged adiabatic film effectiveness data are presented as they vary with stream wise position x/D for different contraction ratios. As such, these figures show approximately invariant effectiveness values at each x/D location as the contraction ratio varies between 1, 3, 4, and 5. The increasing spatially-averaged effectiveness values with x/D are a result of the continual accumulation of coolant with stream wise development. Such accumulation of coolant concentrations has a more important influence on effectiveness magnitude, than the effects of acceleration or freestream turbulence intensity (Ligrani et al., 2013). The accumulations also further illustrate the character of abundant over cooling from a dense cooling array.
4.6 Contraction ratio and blowing ratio effects on heat transfer coefficients for a dense hole array
Spatially-averaged iso-energetic heat transfer coefficients at different contraction ratios Cr for blowing ratios BR of 5.0 and 10.0, are presented in Figs. 14 and 15, respectively. These data represent a stream wise hole inclination angle of 20o, a stream wise hole spacing X/D of 6, and a span wise hole spacing Y/D of 5.
Within Figs. 14 and 15, spatially-averaged heat transfer coefficients are generally higher at smaller x/D locations because of the shear augmentations which occur as the most upstream rows of film cooling jets are initially ejected into the boundary layer. Here, complex interactions between different adjacent film jets and the boundary layer augment mixing and turbulent transport levels, particularly at x/D locations up to around 100. The stream wise periodicity of the distributions are a result of the pairs of film cooling hole rows, which are staggered with respect each other in adjacent rows. The detrimental effects of mainstream acceleration are apparent since heat transfer coefficients for contraction ratios Cr of 3 and 5 are often higher than values for Cr=1, especially for larger x/D values greater than 100.
4.7 Hole angle, contraction ratio, and blowing ratio effects on adiabatic film effectiveness for a dense hole array
To illustrate the effects of stream wise hole injection angle (along with blowing ratio and contraction ratio), spatially-averaged adiabatic effectiveness data are given for stream wise hole inclination angles of 20o and 30o. These data are presented in Figs. 16 and 17 for different blowing ratios, and for contraction ratios Cr of 1 and 4. The data in Figs. 16 and 17 are presented for blowing ratios BR of 5.0 and 10.0, respectively. Within each figure, comparisons are made for contraction ratios Cr of 1 and 4, and stream wise hole inclination angles of 20o and 30o. These spatially-averaged effectiveness data show slight dependence upon contraction ratio for the α=30o data, with less dependence for a stream wise hole angle α of 20o. Such variations are illustrated by higher Cr=1 and α=30o values compared to Cr=4 and α=30o values, especially when compared at x/D locations which are less than 50 to 70. In contrast, the Cr=1 and α=20o data are generally similar in magnitude to the Cr=4 and α=20o data, when compared at particular x/D locations.
Because a dense hole array is employed, Figs. 16 and 17 again show dramatic increases of spatially-averaged effectiveness with stream wise development for each experimental configuration examined, illustrating rapid generation, accumulation, and development of a protective film layer. This is, of course, consistent with a boundary layer with excess amounts of coolant present. According to Ligrani et al. [3], designers are interested in lean burning combustors with reduced coolant flow. Traditionally combustor liners are overcooled due to the high pressure ratios required by the injector and the dense arrays required to minimise thermal gradients. However innovative cooling schemes such as multi- layer liners make lower blowing ratios and more appropriate coolant flow rates possible. The effects associated with a contraction also cause a significant change in cooling performance for conditions that are not overcooled. It is therefore essential that designers of leaner systems take these conditions into account to ensure proper cooling.
4.8 Hole angle, contraction ratio, and blowing ratio effects on heat transfer coefficients for a dense hole array
Spatially-averaged iso-energetic heat transfer coefficients for blowing ratios BR of 5.0 and 10.0, are presented in Figs. 18 and 19, respectively. These data are provided for a stream wise hole spacing X/D of 6, and a span wise hole spacing Y/D of 5. Within each figure, data are given for two arrangements: Cr=1 and α=30o, and Cr=4 and α=30o. The second of these figures also include data for Cr=1 and α=20o. Figures 18 and 19 show that the Cr=1 and α=30o, and Cr=4 and α=30o data sets are in approximate agreement at each x/D location. When present, the spatially-averaged heat transfer coefficients for Cr=1 and α=20o are then often lower than values measured for α=30o, particularly when the comparisons are made at x/D locations which are greater than 50.
4.9 Comparisons of adiabatic effectiveness for sparse and dense hole arrays
Figure 20 compares line-averaged adiabatic film effectiveness data for sparse and dense film cooling hole arrays. Within this figure, effectiveness values at any particular x/D location are generally and often higher for the dense X/D=6 array than for the sparse X/D=18 array, when compared at the same stream wise location and the same blowing ratio. In addition, the dense array data show much more dramatic increases with stream wise development, illustrating more rapid generation, accumulation, and development of a protective film layer.
4.10 Comparisons of heat transfer coefficients for sparse and dense hole arrays
Figure 21 compares line-averaged heat transfer coefficient data for sparse and dense film cooling hole arrays. These data are given for X/D=6 and X/D=18, with Y/D = 5, a blowing ratio BR of 5.0, and a contraction ratio Cr of 4. The figure shows that line-averaged heat transfer coefficients are generally higher with the X/D=6 dense hole array, relative to the X/D=18 sparse array, when compared at a particular x/D stream wise location and the same blowing ratio. Heat transfer coefficient variations with stream wise development are also much larger for the dense array. This is mostly because of complex interactions between different adjacent film jets, and the boundary layer, which augment mixing and turbulent transport levels, especially at x/D locations from 25 to 50.
4.11 Comparisons of contraction ratio effects and the influences of mainstream acceleration
Figures 4, 5b, 22, and 23 provide comparisons to illustrate the effects of contraction ratio and mainstream acceleration on film cooling performance. The variation of acceleration parameter through the test section for contraction ratios Cr of 1, 3, 4, and 5 is shown in Fig. 4. Here, the acceleration parameter K is determined using the equation given above. K values for Cr=1 are in the vicinity of 1×10⁻⁶, whereas K values for Cr =4 range from 1×10⁻⁶ to 2.7×10⁻⁶.
The variation of coolant mass flow rate per unit of mainstream mass flow rate is shown in Fig. 5b. These data are given for X/D=6, Y/D = 5, a blowing ratio BR of 5.0, and contraction ratios Cr of 1, 3, 4, and 5. The prohibitively large amounts of film required for cooling are illustrated by this figure. For Cr=1, the total sum of all coolant relative to the bulk flow is 0.209, and for Cr=4, the total sum of all coolant relative to the bulk flow is 0.292.
Corresponding line-averaged adiabatic film effectiveness data are given in Figs. 22 and 23, with Y/D = 5, a blowing ratio BR of 5.0, contraction ratios Cr of 1 and 4, and line-averaging over y/D. Figures 22 and 23 are given for X/D values of 6 and 18, respectively. Overall, these data show that line-averaged effectiveness values change significantly with contraction ratio for the spare hole array with X/D=18, but not with the dense hole array when X/D=6. This lack of dependence on blowing ratio for the dense hole array illustrates injection of excess coolant into the mainstream flow, an arrangement typical of applications wherein design simplicity is mandated by cost constraints. Data obtained with the relatively sparse array of holes with X/D=18 generally do not show characteristics of overcooled flow. Here, line-averaged effectiveness values decrease when Cr increases from 1 to 4 for X/D=18, which illustrates the degradation effects of acceleration on film cooling effectiveness and performance.
5. Summary and Conclusions
Presented are full-coverage, film cooling experimental data, for a film which develops along one surface of a contraction passage, which is designed to impose experimental conditions which simulate those which exist within combustor liner components of gas turbine engines. As such, distributions of static pressure, freestream velocity, freestream flow mass flux, coolant flow mass flux, and local film cooling blowing ratio all vary with streamwise location through the test section. Measured quantities include surface variations of adiabatic film cooling effectiveness, as well as iso-energetic heat transfer coefficient. Film cooling holes are sharp-edged, and streamwise inclined at inclination angles of either 20o or 30o with respect to the liner surface. The blowing ratios which are employed are 2.0, 5.0, and 10.0, where each designated value is given for the entrance of the test section. Flow passage contraction ratios Cr are 1, 3, 4, and 5. Sparse and dense film cooling hole arrays are utilized with different streamwise and spanwise film cooling hole spacings, X/D and Y/D. Coolant Reynolds number Refc is 12,000 for a blowing ratio of 5.0, freestream temperatures range from 75ºC to 115ºC, the film hole diameter is 7 mm, and density ratios range from 1.15 to 1.25. The discharge coefficient for the entire film cooling test surface is 0.72, and the longitudinal turbulence intensity at the inlet of the film cooling test section is approximately 8.5 percent. The film is turbulent for all experimental conditions investigated. Of particular interest are the effects of the following parameters: (1) blowing ratio BR, (2) magnitude of main flow stream wise static pressure gradient (quantified by mainstream passage contraction ratio Cr values of 1, 3, 4, and 5), (3) stream wise development (quantified by variations with x/D), (4) effusion cooling hole inclination angle α, and (5) effusion hole spacing, ranging from dense to sparse (characterized by X/D values of 6 and 18, and Y/D values of 3, 5, and 7).
REFERENCES:
Enhancement of Convective Heat Transfer. (2016) Handbook of Thermal Science and Engineering, Springer Publishing Corp., New York, N. Y., U.S.A.
Leger, B., Miron, P., Emidio, J. M. (2002) Geometric and Aero-Thermal Influences on Multiholed Plate Temperature: Application on Combustor Wall. International Journal of Heat and Mass Transfer 46: 1215-1222.
Ligrani, P. M., Goodro, M., Fox, M., Moon, H.-K. (2012) Full-Coverage Film Cooling: Film Effectiveness and Heat Transfer Coefficients For Dense and Sparse Hole Arrays at Different Blowing Ratios. ASME Transactions-Journal of Turbomachinery 134(6): 061039-1 to 061039-13.
Ligrani, P. M., Goodro, M., Fox, M., Moon, H.-K. (2013) Full-Coverage Film Cooling: Film Effectiveness and Heat Transfer Coefficients For Dense Hole Arrays at Different Hole Angles, Contraction Ratios, and Blowing Ratios. ASME Transactions-Journal of Heat Transfer 135(3): 031707-1 to 031707-14.
Ligrani, P. M., Goodro, M., Fox, M., Moon, H.-K. (2015) Full-Coverage Film Cooling: Heat Transfer Coefficients and Film Effectiveness For a Sparse Hole Array at Different Blowing Ratios and Contraction Ratios. ASME Transactions-Journal of Heat Transfer 137(3): 032201-1 to 032201-12.
Lin, Y., Song, B., Li, B., Liu, G., Wu, Z. (2003) Investigation of Film Cooling Effectiveness of Full-Coverage Inclined Multihole Walls with Different Hole Arrangements. ASME Paper Number GT-2003-38881.
Sasaki, M., Takahara, K., Kumagai, T., Hamano, M. (1979) Film Cooling Effectiveness for Injection from Multirow Holes. ASME Transactions – Journal of Engineering for Power 101: 101-108.
Scrittore, J. J., Thole, K. A., Burd, S. W. (2007) Investigation of Velocity Profiles for Effusion Cooling of a Combustor Liner. ASME Transactions – Journal of Turbomachinery 129: 518-526.
Ligrani, P. M., Full-Coverage Effusion Cooling in External Forced Convection: Sparse and Dense Hole Arrays. Handbook of Thermal Science and Engineering (Editor-in-Chief: Francis A. Kulacki), Springer International Publishing AG, Springer Publishing Corporation, New York, New York, USA 10: 425-446, 2018.
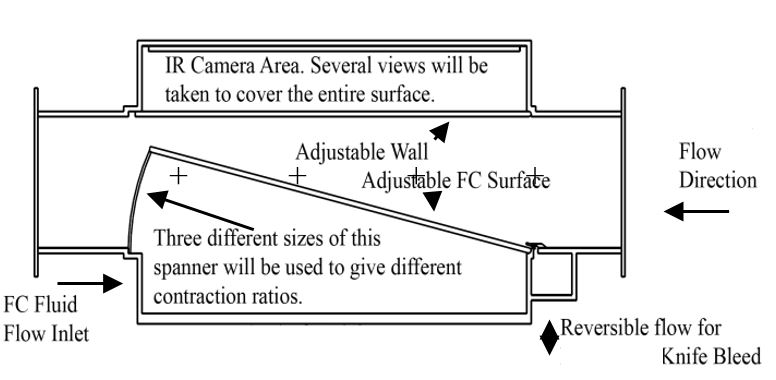
Figure 1. Film cooling test section. + denotes measurement location for mainstream static pressure, from Ligrani et al. (2013, 2015).
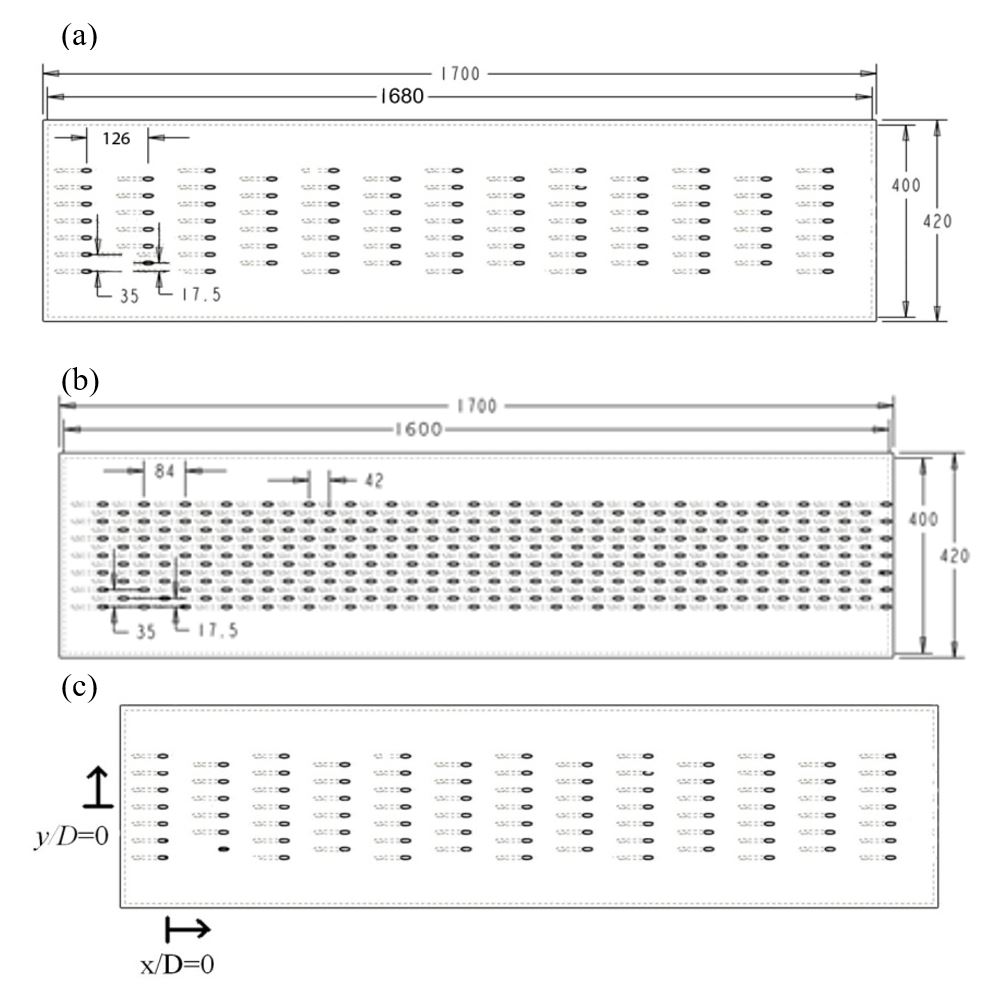
Figure 2. Film cooling test plates for and hole angle 20º. (a) Test section dimensions and layout for sparse hole array with X/D = 18, Y/D = 5, where all dimensions are given in millimetres. (b) Test section dimensions and layout for dense hole array with X/D = 6, Y/D = 5, where all dimensions are given in millimetres., (c) Test section coordinate system X/D = 18, Y/D = 5, from Ligrani et al. (2012, 2015).
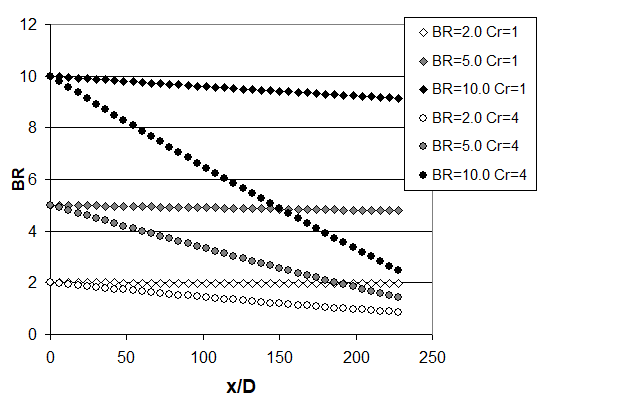
Figure 3. Blowing ratio variation with x/D for different contraction ratios, calculated on the basis of static pressure ratios, from Ligrani et al. (2015).
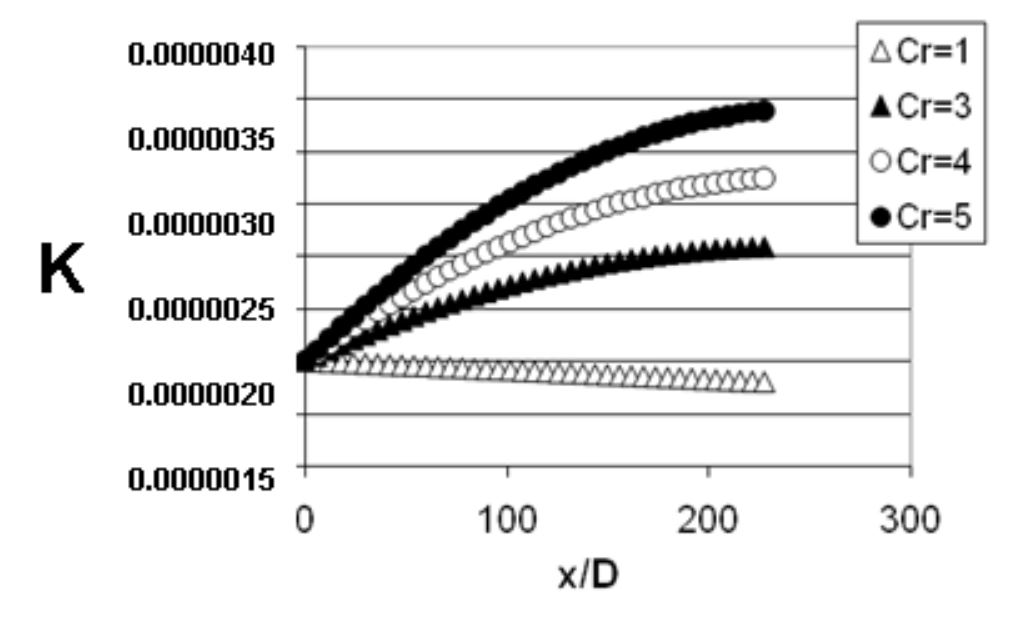
Figure 4.Variation of acceleration parameter through the test section for contraction ratios Cr of 1, 3, 4, and 5, from Ligrani et al. (2013).
a).
b).
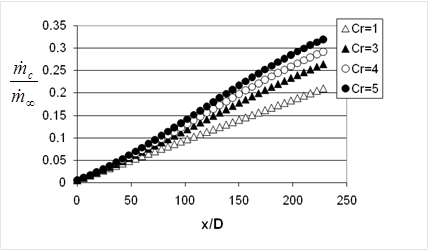
Figure 5. (a) Variation of ratio of coolant mass flow rate to mainstream mass flow rate for a sparse hole array with X/D=18, Y/D = 5, and a blowing ratio BR of 5.0 for contraction ratios Cr of 1 and 4. (b) Variation of ratio of coolant mass flow rate to mainstream mass flow rate for a dense hole array with X/D=6, Y/D = 5, and a blowing ratio BR of 5.0 for contraction ratios Cr of 1, 3, 4, and 5, from Ligrani et al. (2013, 2015).
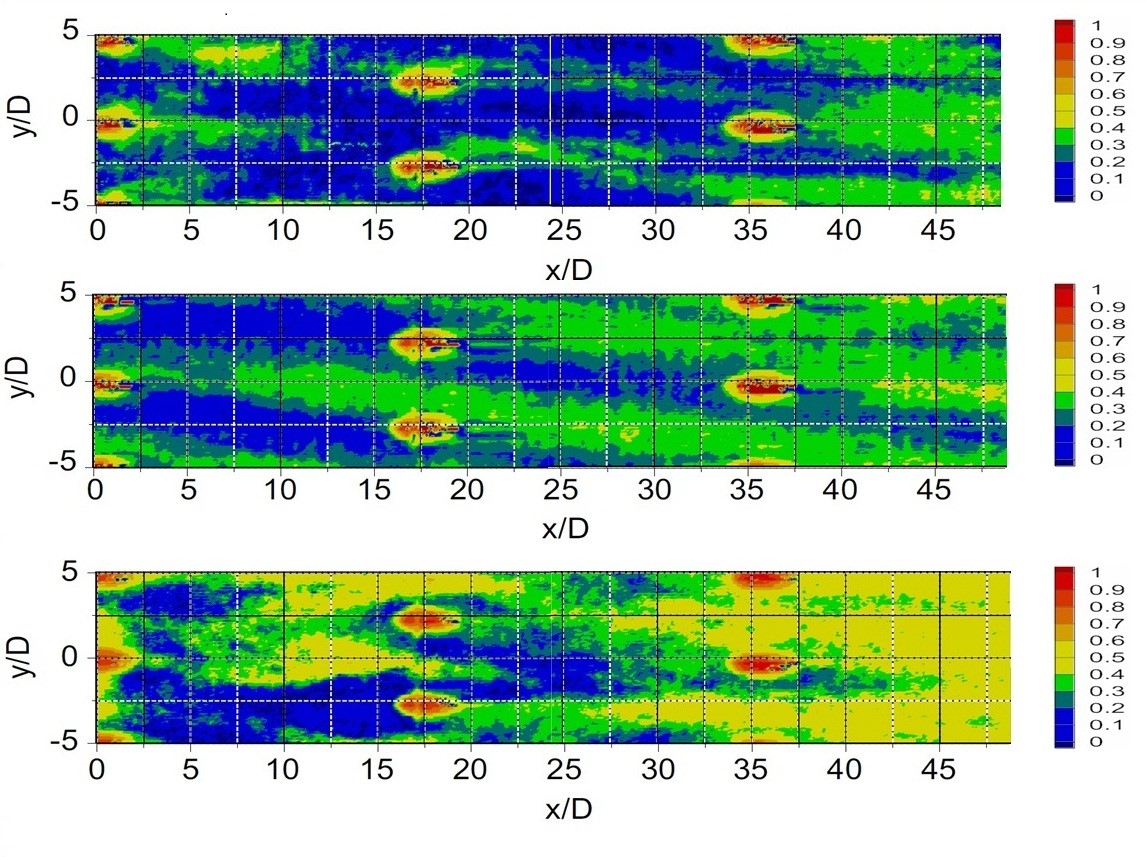
Figure 6. Spatially-resolved and instantaneous surface adiabatic effectiveness for hole spacing X/D=18, Y/D=5, contraction ratio Cr=4, and hole inclination angle α=20º, for a blowing ratio BR 10.0, from Ligrani et al. (2015).
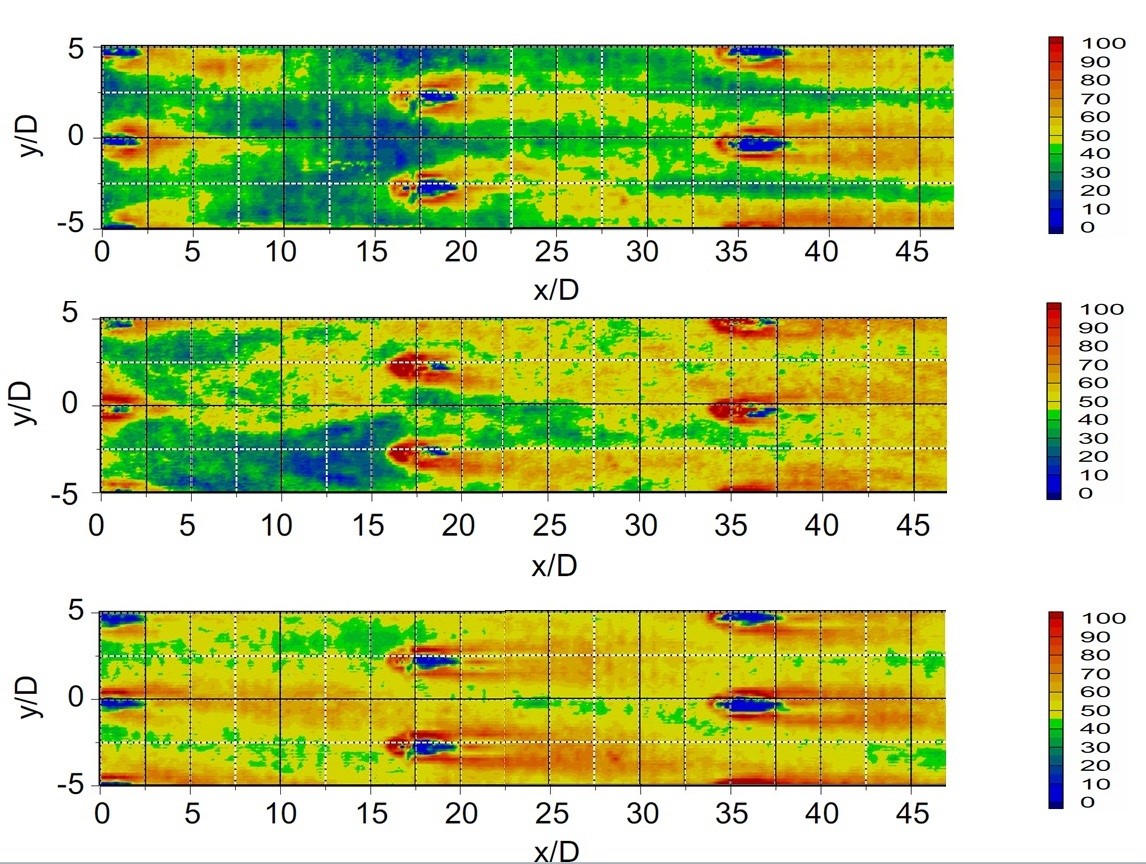
Figure 7. Spatially-resolved surface heat transfer coefficients for hole spacing X/D=18, Y/D=5, contraction ratio Cr=4, and hole inclination angle α=20º, for a blowing ratio BR of 10.0, from Ligrani et al. (2015).
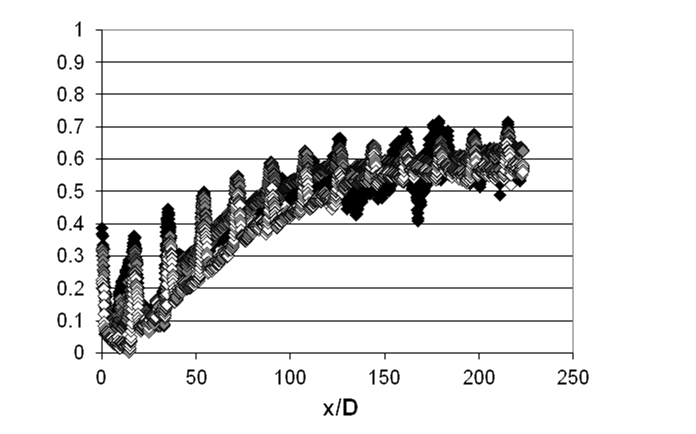
Figure 8. Line-averaged adiabatic film effectiveness for hole spacings X/D=18 and Y/D=5, streamwise hole inclination angle of 20o, and contraction ratios Cr of 1, with line-averaging over y/D. Data given for blowing ratio BR values of 2.0, 5.0. and 10.0, from Ligrani et al. (2015).
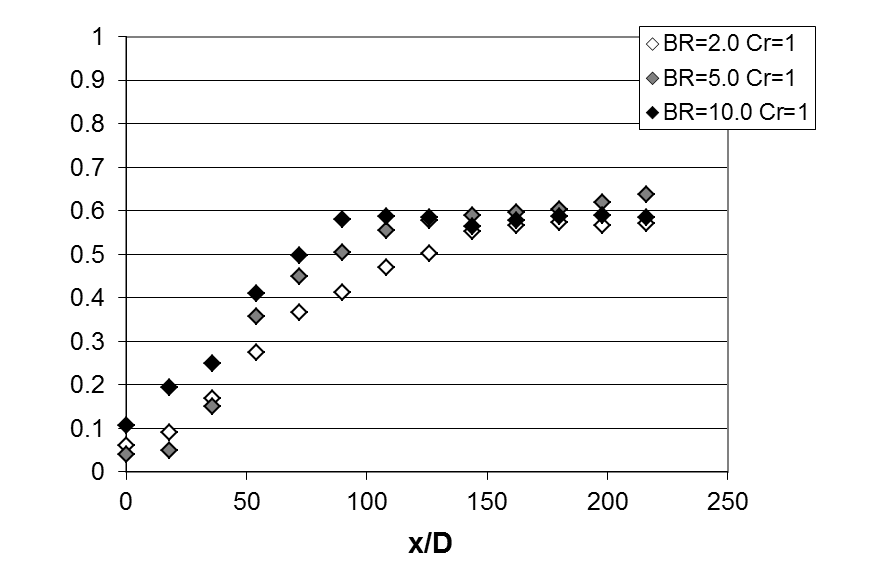
Figure 9. Area-averaged adiabatic film effectiveness for hole spacings X/D=18 and Y/D=5, streamwise hole inclination angle of 20o, and contraction ratios Cr of 1. Data given for blowing ratio BR values of 2.0, 5.0. and 10.0, from Ligrani et al. (2015).
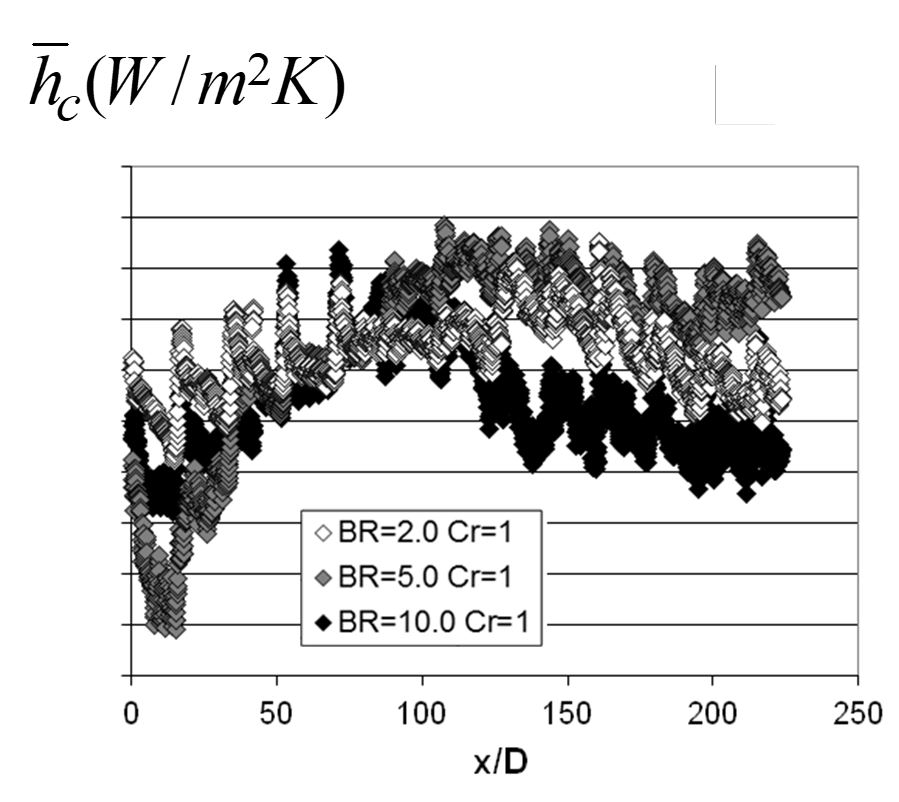
Figure 10. Line-averaged surface heat transfer coefficients for hole spacings X/D=18 and Y/D=5, streamwise hole inclination angle of 20o, and contraction ratios Cr of 1, with line-averaging over y/D. Data given for blowing ratio BR values of 2.0, 5.0. and 10.0, from Ligrani et al. (2015).
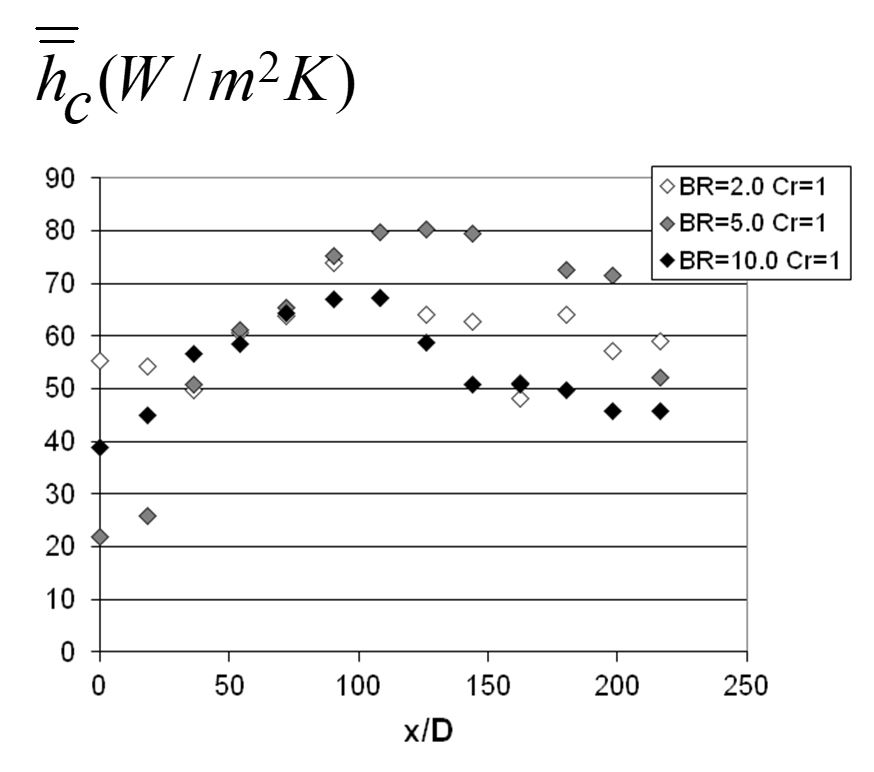
Figure 11. Area-averaged surface heat transfer coefficients for hole spacings X/D=18 and Y/D=5, streamwise hole inclination angle of 20o, and contraction ratios Cr of 1. Data given for blowing ratio BR values of 2.0, 5.0. and 10.0, from Ligrani et al. (2015).
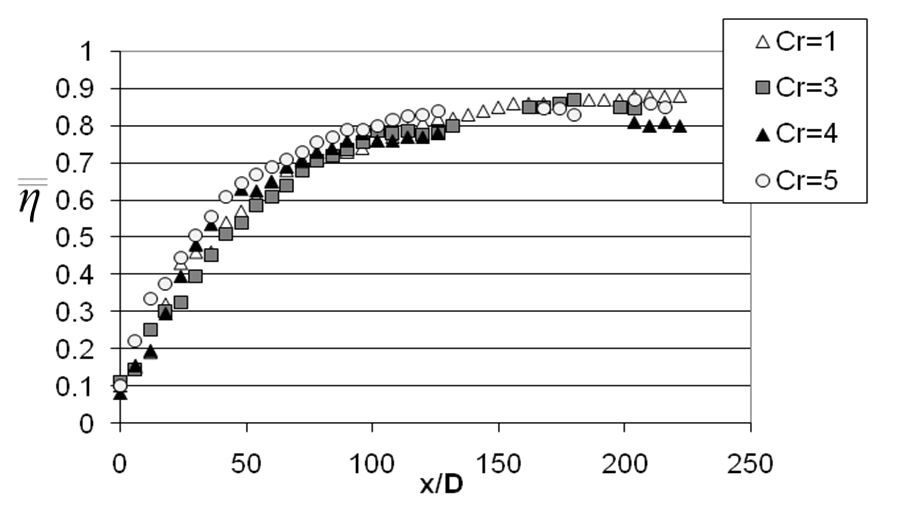
Figure 12. Variations of spatially-averaged adiabatic film effectiveness at different contraction ratios Cr for blowing ratio BR of 5.0, streamwise hole inclination angle of 20o, streamwise hole spacing X/D of 6, and spanwise hole spacing Y/D of 5, from Ligrani et al. (2013).
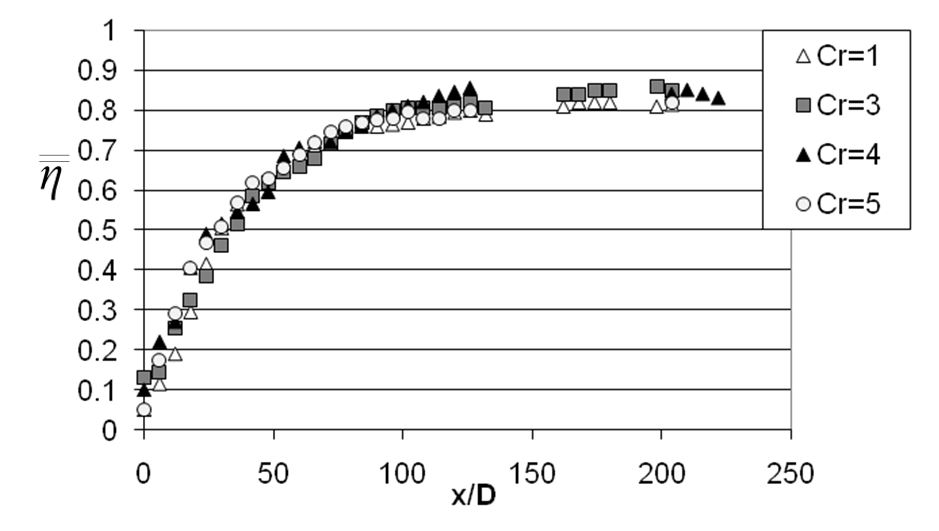
Figure 13. Variations of spatially-averaged adiabatic film effectiveness at different contraction ratios Cr for blowing ratio BR of 10.0, streamwise hole inclination angle of 20o, streamwise hole spacing X/D of 6, and spanwise hole spacing Y/D of 5, from Ligrani et al. (2013).
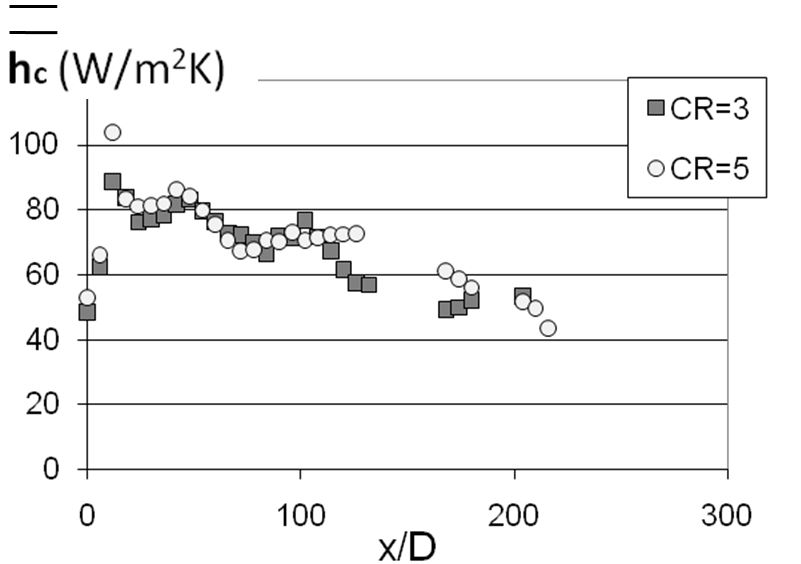
Figure 14. Spatially-averaged heat transfer coefficients at different contraction ratios Cr for blowing ratio BR of 5.0, streamwise hole inclination angle of 20o, streamwise hole spacing X/D of 6, and spanwise hole spacing Y/D of 5, from Ligrani et al. (2013).
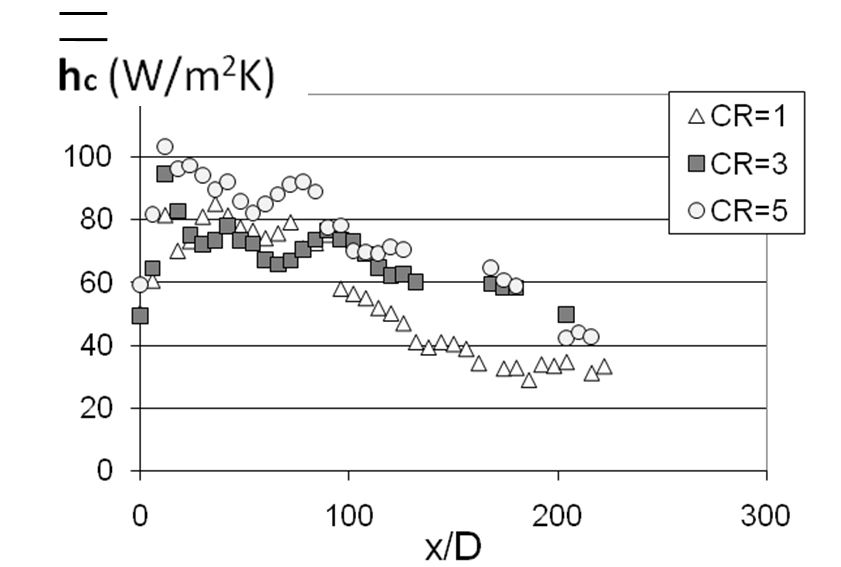
Figure 15. Spatially-averaged heat transfer coefficients at different contraction ratios Cr for blowing ratio BR of 10.0, streamwise hole inclination angle of 20o, streamwise hole spacing X/D of 6, and spanwise hole spacing Y/D of 5, from Ligrani et al. (2013).
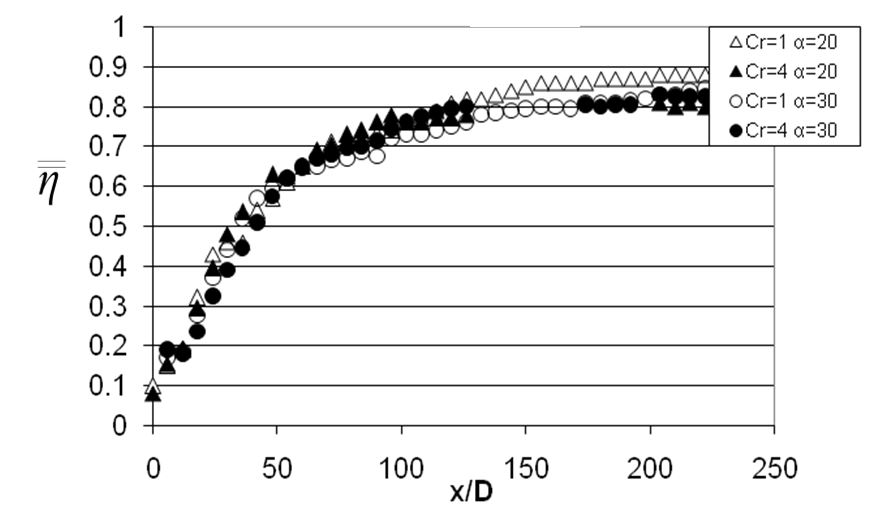
Figure 16. Variations of spatially-averaged adiabatic film effectiveness for blowing ratio BR of 5.0, hole spacings X/D=6 and Y/D=5, streamwise hole inclination angles of 20o and 30o, and contraction ratios Cr of 1 and 4, from Ligrani et al. (2013).
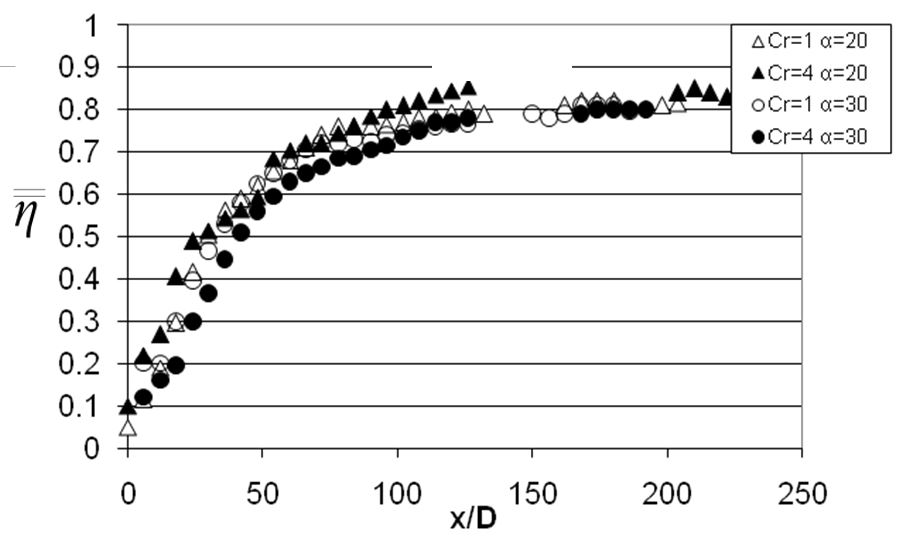
Figure 17. Variations of spatially-averaged adiabatic film effectiveness for blowing ratio BR of 10.0, hole spacings X/D=6 and Y/D=5, streamwise hole inclination angles of 20o and 30o, and contraction ratios Cr of 1 and 4, from Ligrani et al. (2013).
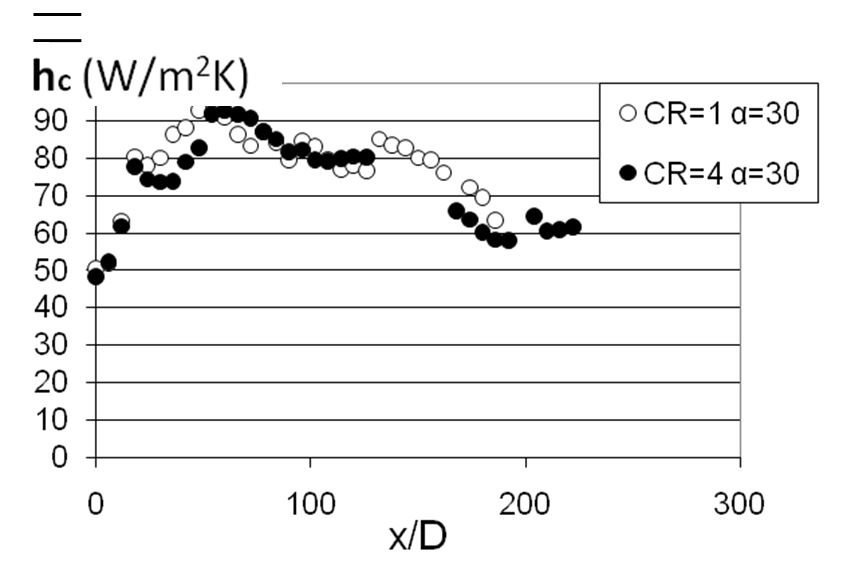
Figure 18. Variations of spatially-averaged heat transfer coefficients for blowing ratio BR of 5.0, hole spacings X/D=6 and Y/D=5, streamwise hole inclination angles of 20o and 30o, and contraction ratios Cr of 1 and 4, from Ligrani et al. (2013).
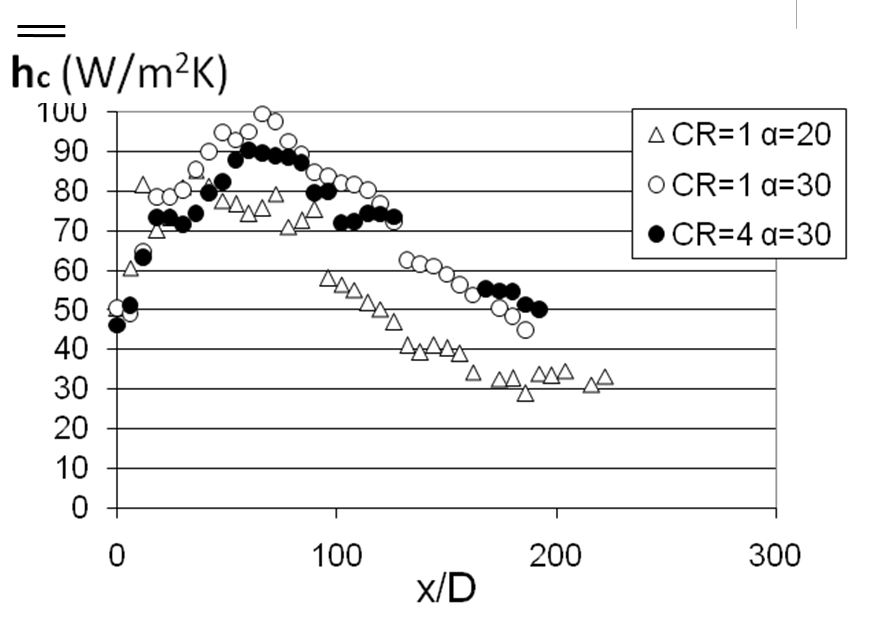
Figure 19. Variations of spatially-averaged heat transfer coefficients for blowing ratio BR of 10.0, hole spacings X/D=6 and Y/D=5, streamwise hole inclination angles of 20o and 30o, and contraction ratios Cr of 1 and 4, from Ligrani et al. (2013).
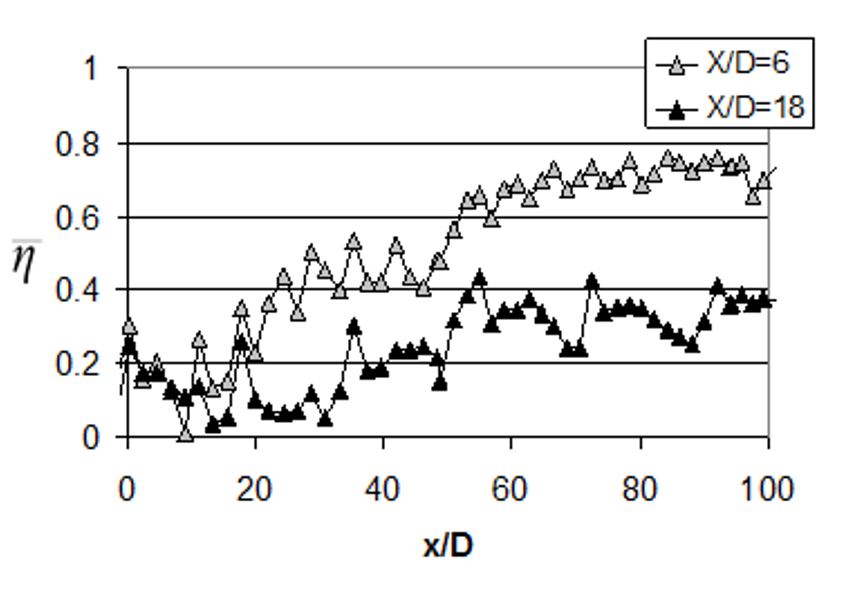
Figure 20. Line-averaged adiabatic film effectiveness for X/D=6 and X/D=18, with Y/D = 5, a blowing ratio BR of 5.0, a contraction ratio Cr of 4, and line-averaging over y/D, from Ligrani et al. (2012).
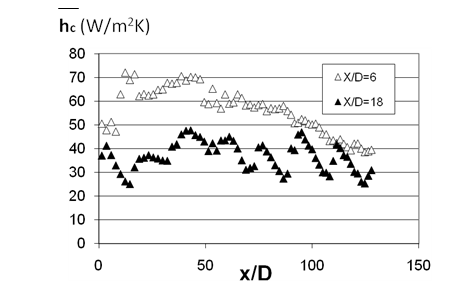
Figure 21. Line-averaged heat transfer coefficients for X/D=6 and X/D=18, with Y/D = 5, a blowing ratio BR of 5.0, a contraction ratio Cr of 4, and line-averaging over y/D, from Ligrani et al. (2012).
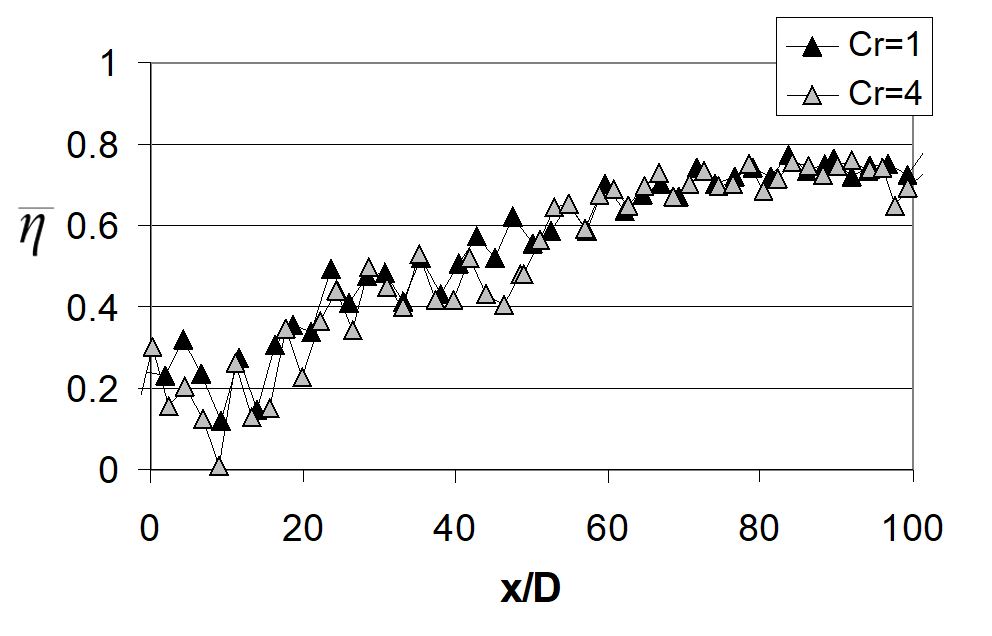
Figure 22. Line-averaged adiabatic film effectiveness, with Y/D = 5, a blowing ratio BR of 5.0, contraction ratios Cr of 1 and 4, line-averaging over y/D, and X/D=6, from Ligrani et al. (2012).
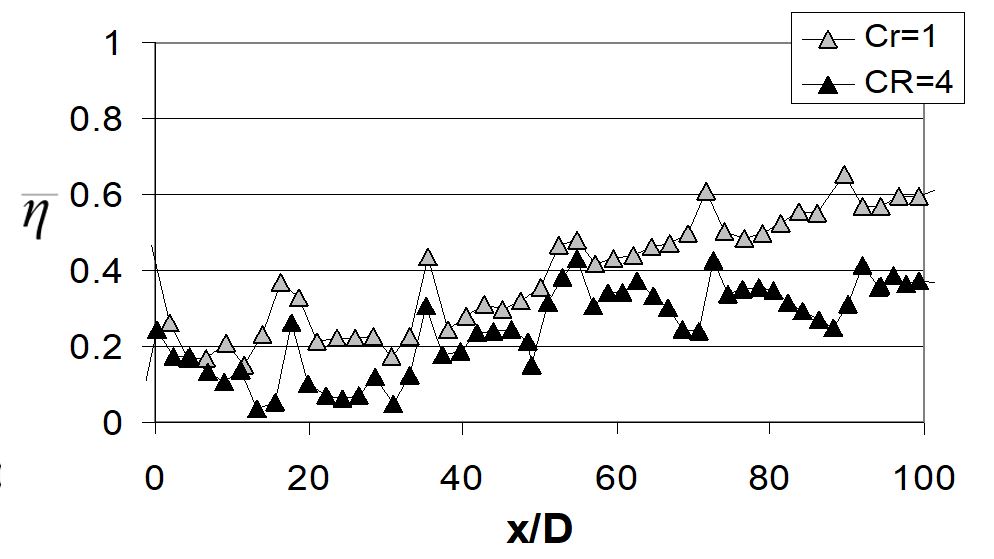
Figure 23. Line-averaged adiabatic film effectiveness, with Y/D = 5, a blowing ratio BR of 5.0, contraction ratios Cr of 1 and 4, line-averaging over y/D, and X/D=18, from Ligrani et al. (2012).